
最近接手一个小项目,需要做一个数据显示大屏,要能显示曲线,显示进出量,重点是要好看,我哪知道什么是好看,就随便做做呗。
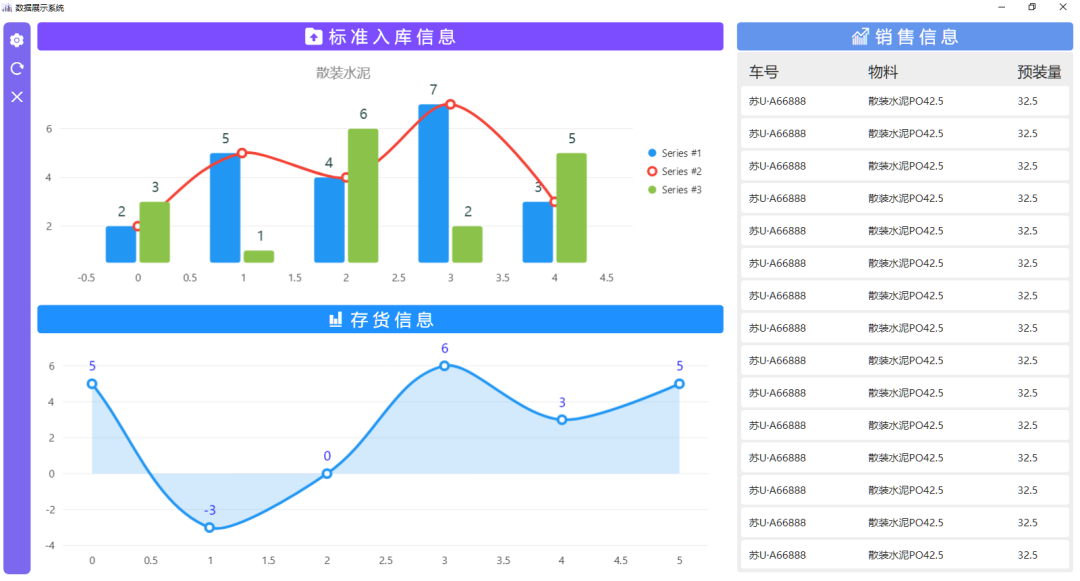
数据都是假的,只是做出一个效果。显示这种数据图,使用的是LiveCharts2。这是一个非常漂亮的 Charts 模块。官网如下:
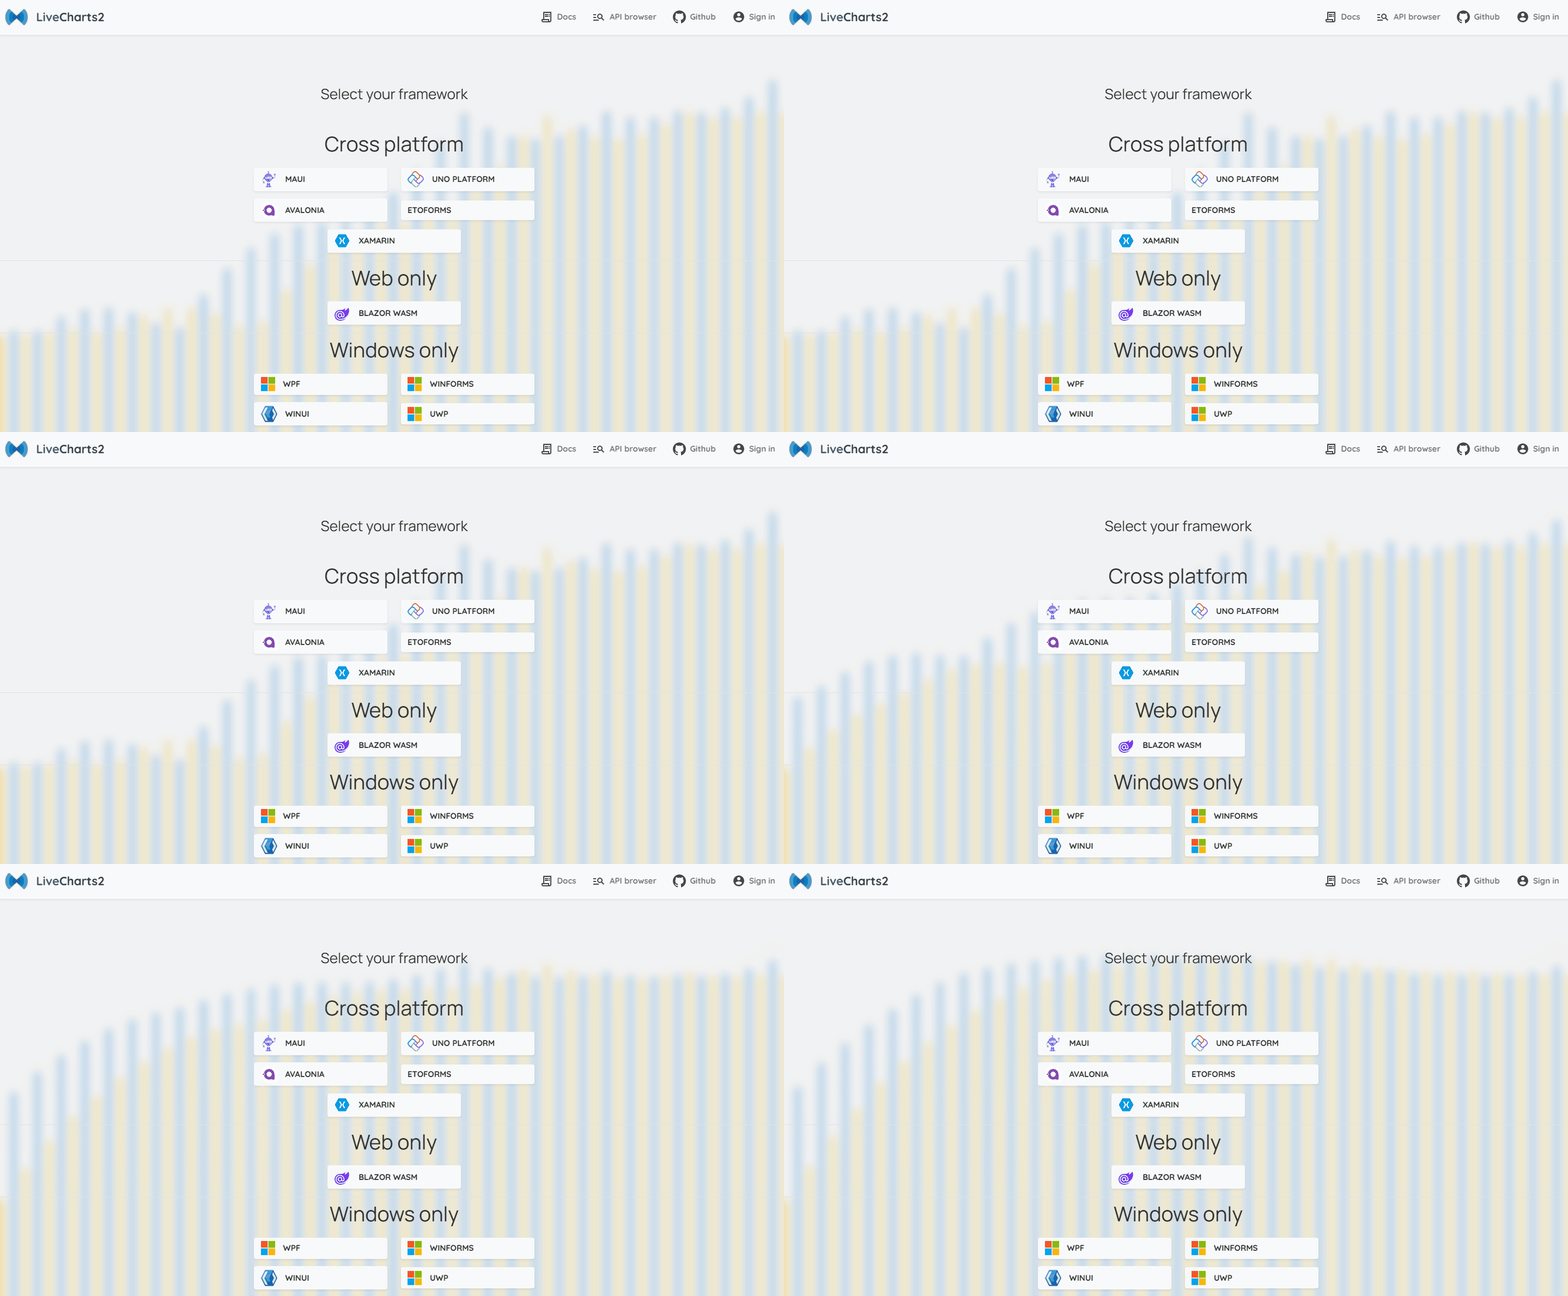
LiveCharts2支持的还挺多,我们在这里选择WPF。
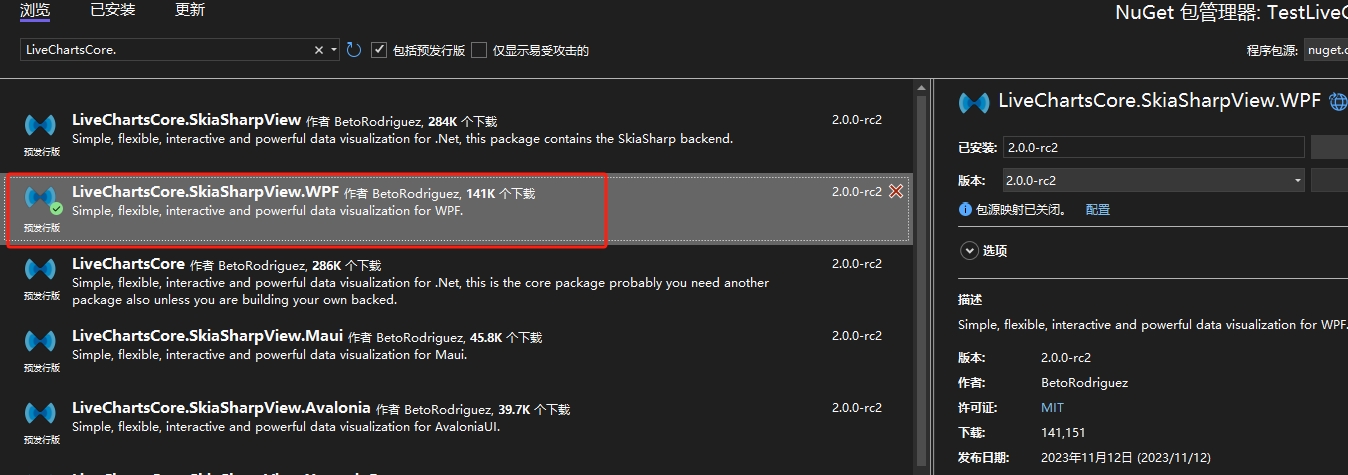
如果我们直接通过NuGet进行搜索,会发现找到的LiveCharts版本较旧。

LiveCharts2相对V0版本做了很多改进和修复,通过NuGet安装LiveChartsCore.SkiaSharpView.WPF。
或者打开程序包管理器控制台,输入:
Install-Package LiveChartsCore.SkiaSharpView.WPF -Version 2.0.0-rc2

等待安装完成,就可以找到了。

顺便安装一下CommunityToolkit.Mvvm,这个可以通过NuGet找到,这个包是因为GalaSoft.MVVMLight已经不再维护,所以官方做的新模型,可以很好的迁移进来。
新建一个MainViewModel,添加引用,增加代码。
using System;
using System.Collections.Generic;
using System.Linq;
using System.Text;
using System.Threading.Tasks;
using LiveChartsCore;
using LiveChartsCore.SkiaSharpView;
using CommunityToolkit.Mvvm.ComponentModel;

namespace LiveChartsDemo
{
    [ObservableObject]
    public partial class MainViewModel
    {
        public ISeries[] Series { get; set; }
            = new ISeries[]
            {
                new LineSeries<double>
                {
                    Values = new double[] { 2, 1, 3, 5, 3, 4, 6 },
                    Fill = null
                }
            };
    }
}
然后到MainWindow.xaml里,引用LiveCharts,设置DataContext。
xmlns:lvc="clr-namespace:LiveChartsCore.SkiaSharpView.WPF;assembly=LiveChartsCore.SkiaSharpView.WPF"
<Window.DataContext>
	<local:MainViewModel />
</Window.DataContext>
然后增加CartesianChart
<Grid>
	<lvc:CartesianChart Series="{Binding Series}" />
</Grid>
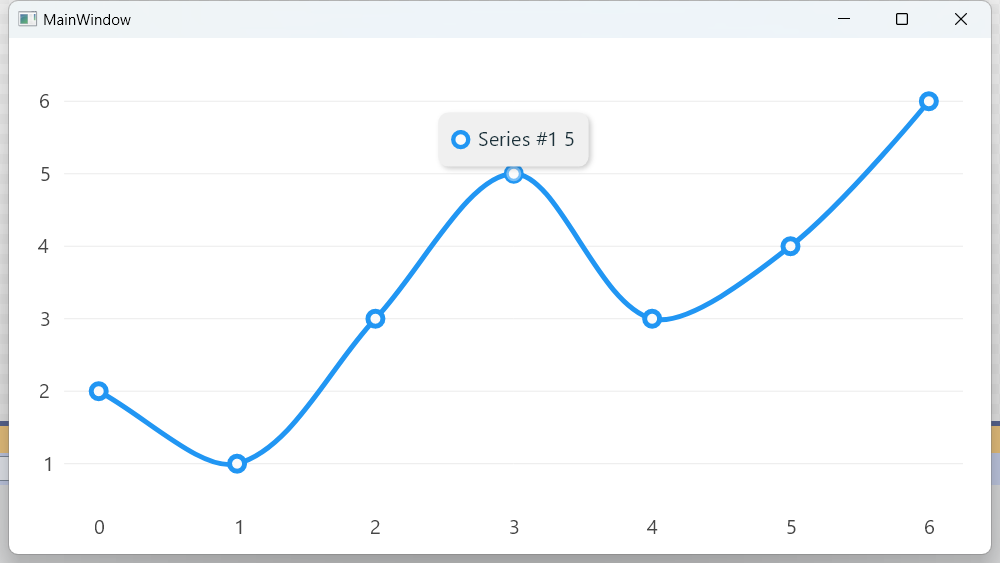
LineSeries为设置的线形图,当然还能有柱状图。
public ISeries[] Series { get; set; }
            = new ISeries[]
            {
                new ColumnSeries<double>
                {
                    Values = new double[] { 2, 1, 3, 5, 3, 4, 6 },
                },
                new LineSeries<double>
                {
                    Values = new double[] { 2, 1, 3, 5, 3, 4, 6 },
                    Fill = null
                },
            };
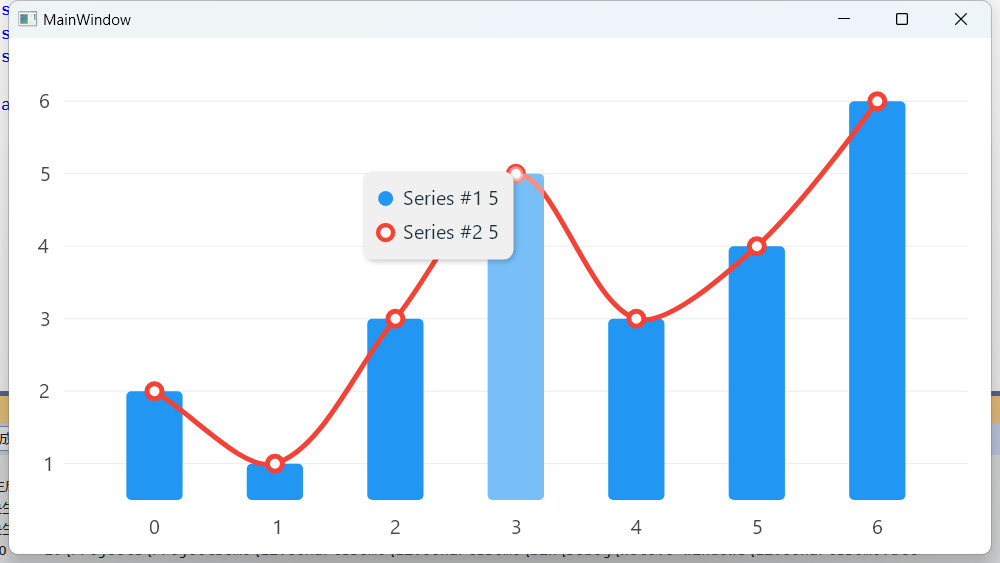
还可以增加 Title,用于说明图标的作用。
public LabelVisual Title { get; set; }
            = new LabelVisual
            {
                Text = "Title",
                TextSize=20,
                Paint = new SolidColorPaint(SKColors.Black)
            };
<lvc:CartesianChart Series="{Binding Series}" Title="{Binding Title}"/>
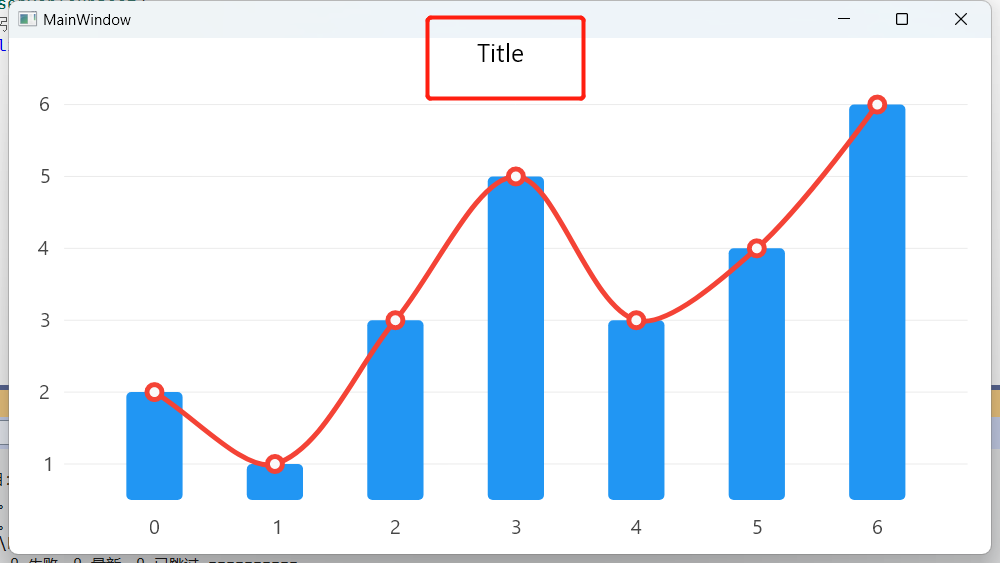
这里就有个问题,如果你的 Title 设置为中文,
public LabelVisual Title { get; set; }
            = new LabelVisual
            {
                Text = "标题",
                TextSize=20,
                Paint = new SolidColorPaint(SKColors.Black)
            };
就显示不出来了
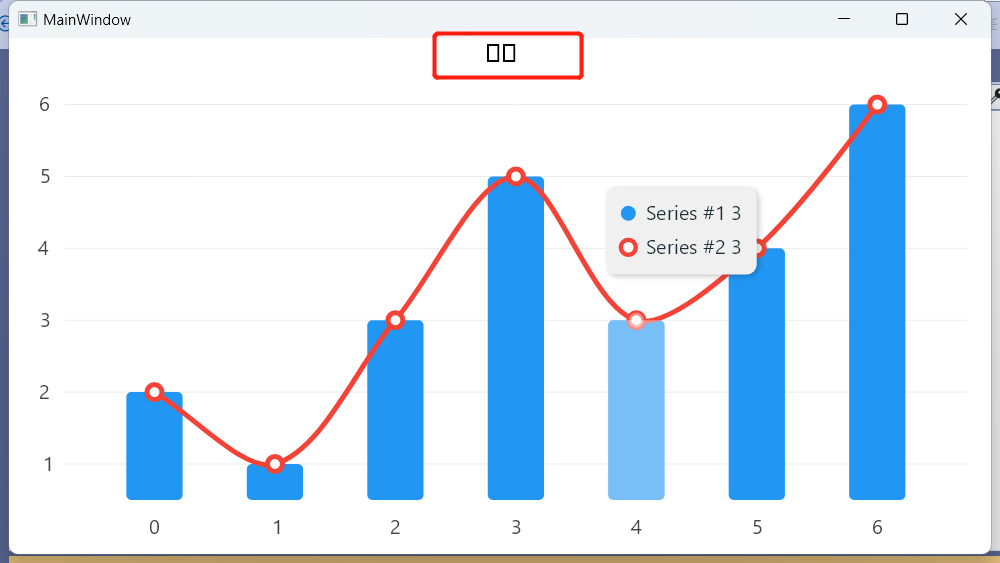
我们需要修改一下设定,以便支持中文显示。
public LabelVisual Title { get; set; }
            = new LabelVisual
            {
                Text = "标题",
                TextSize=20,
                Paint = new SolidColorPaint {
                    Color = SKColors.Black,
                    SKTypeface = SKFontManager.Default.MatchCharacter('汉')
                },
            };
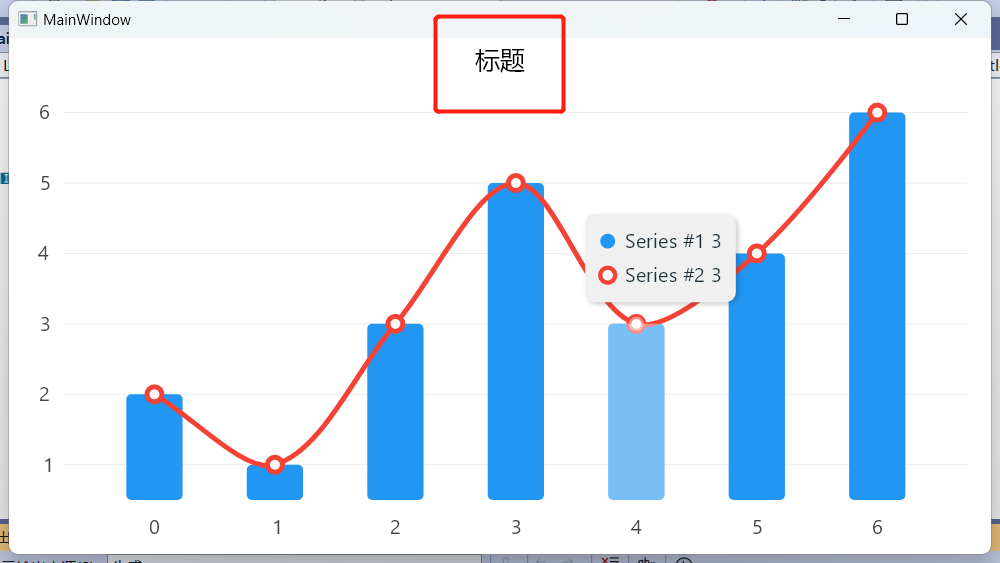
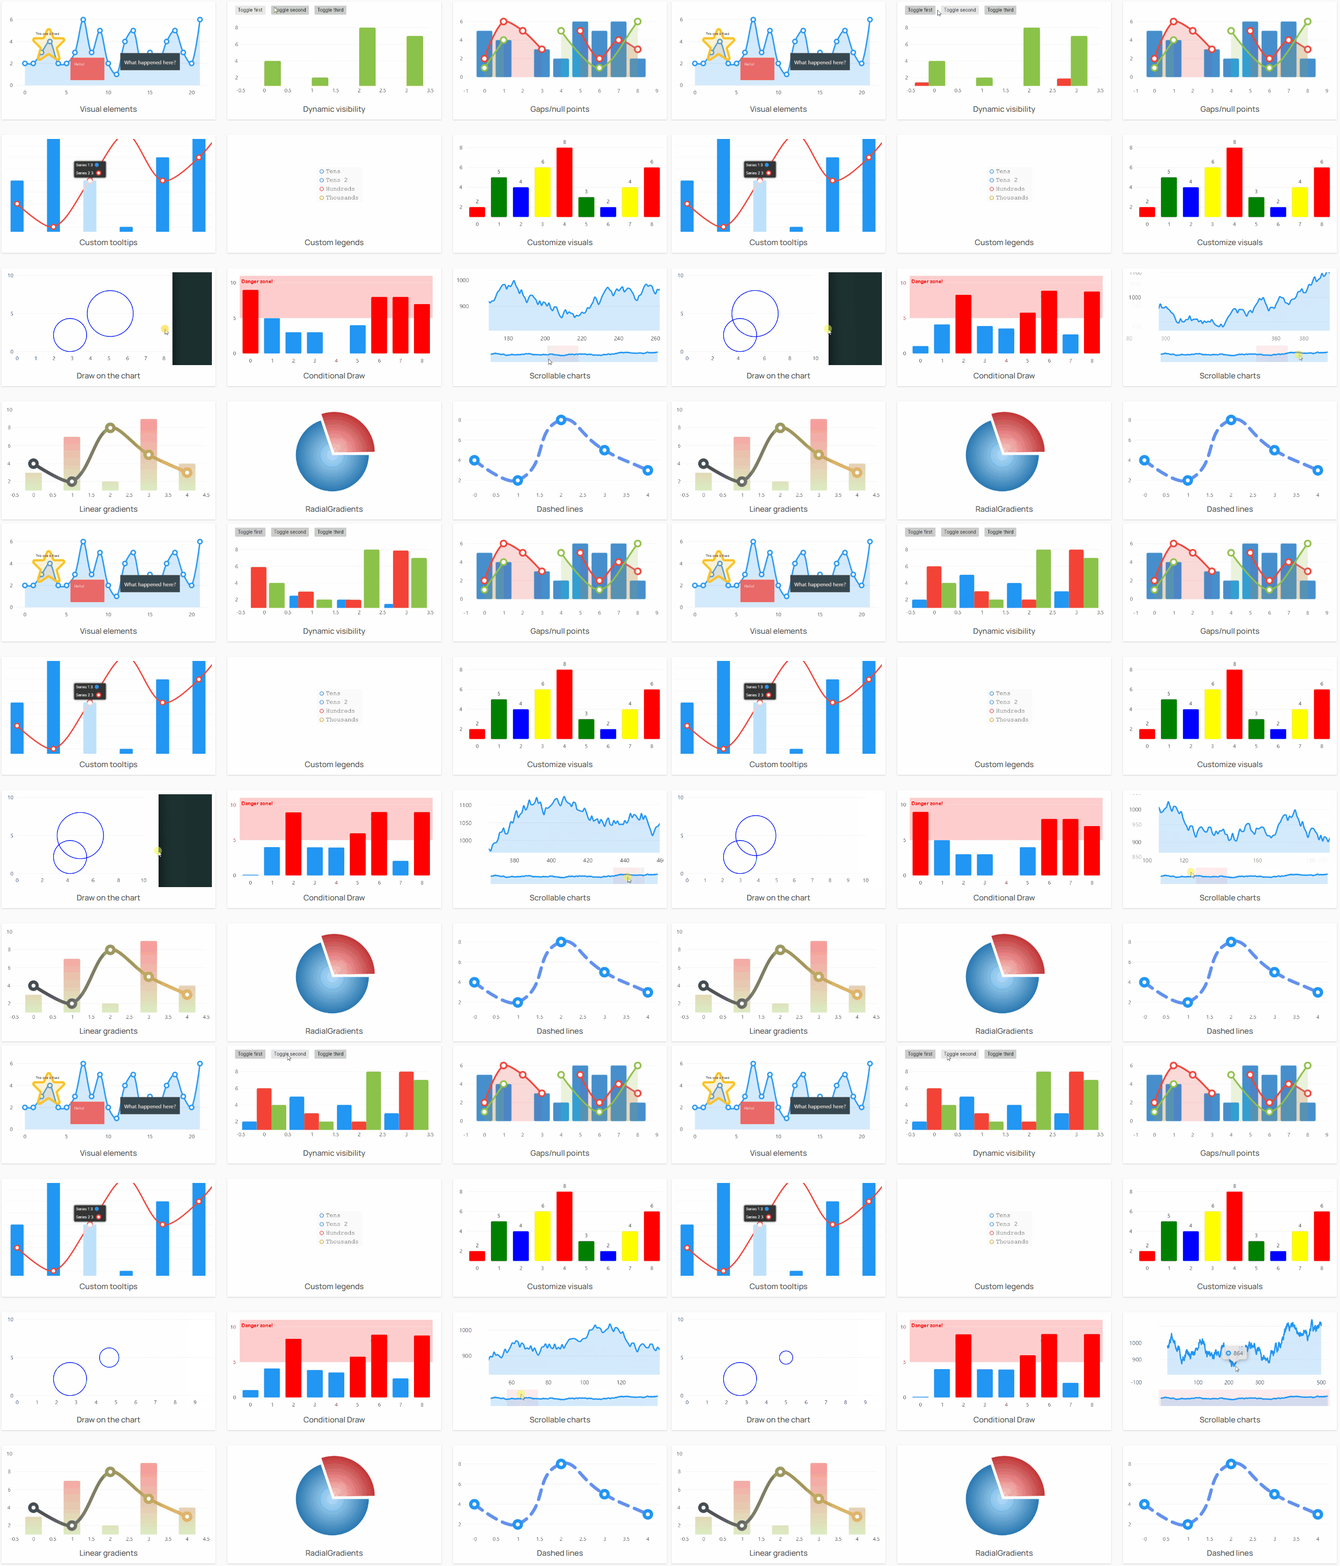
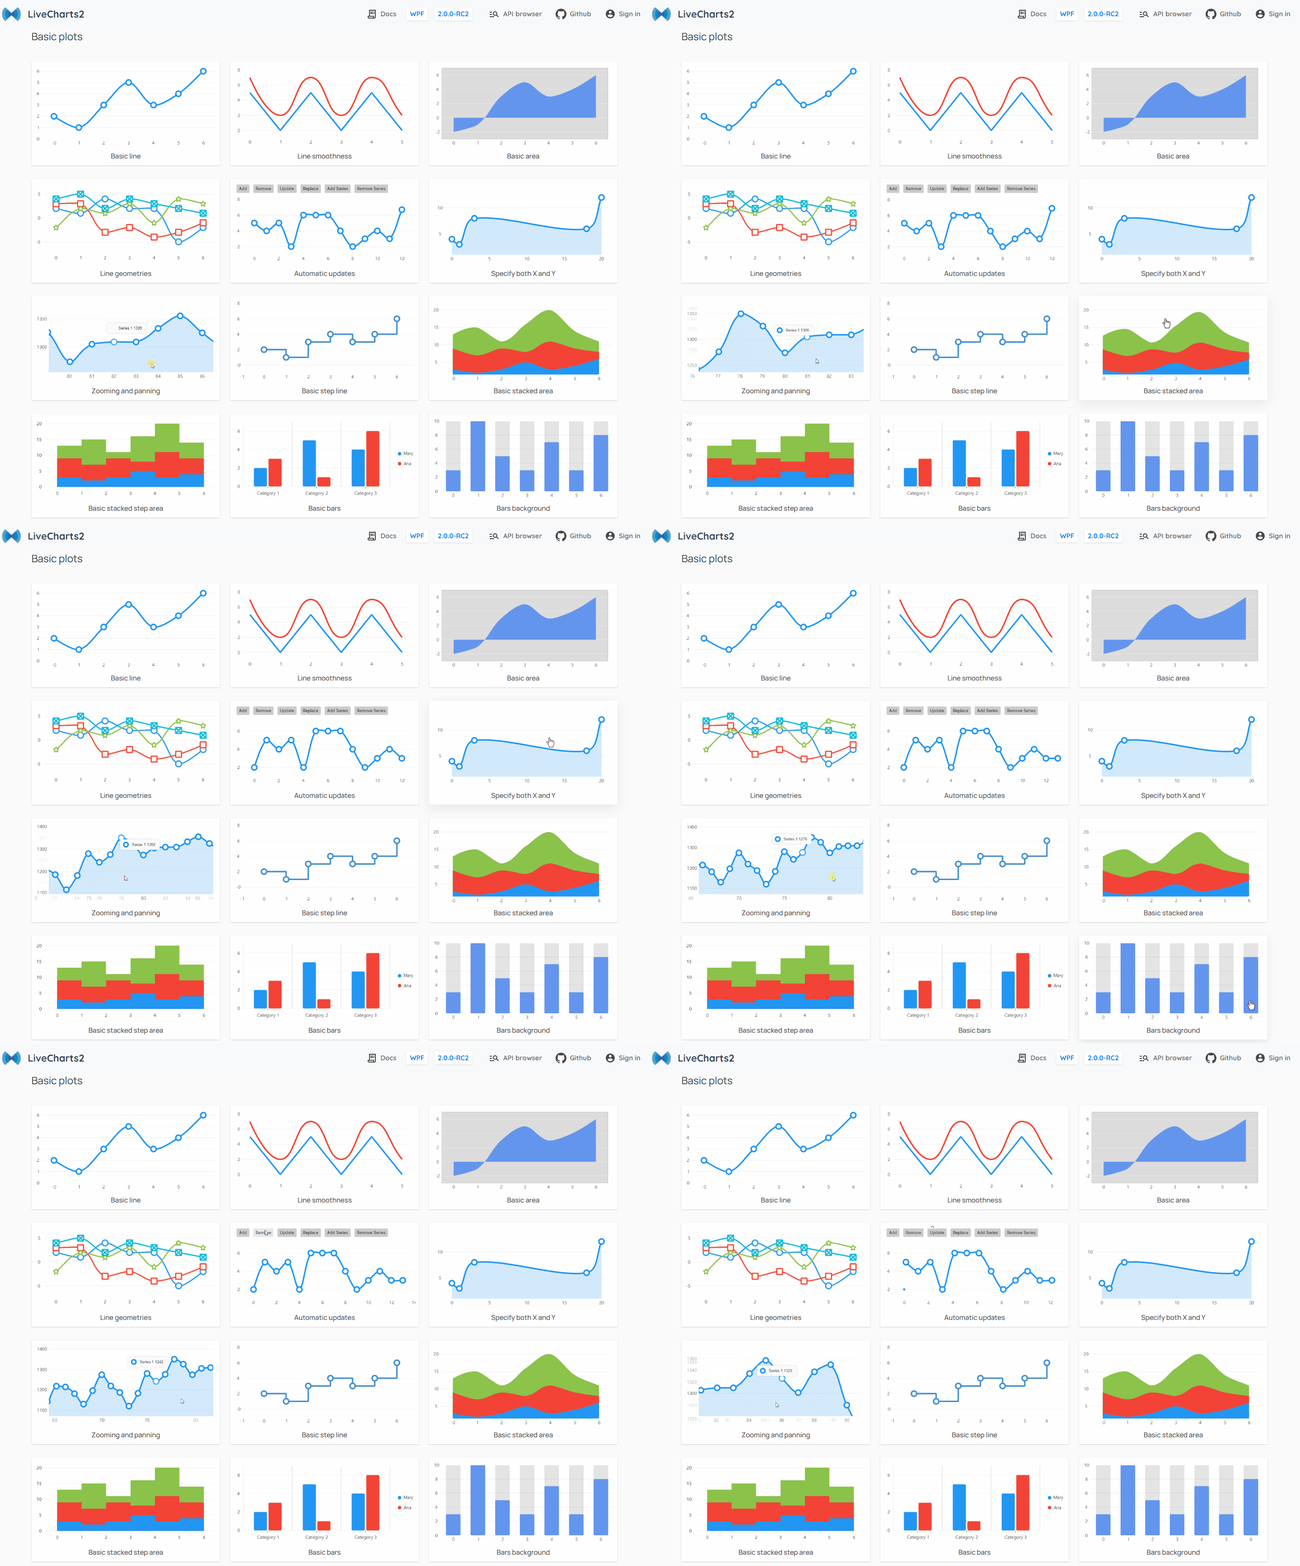
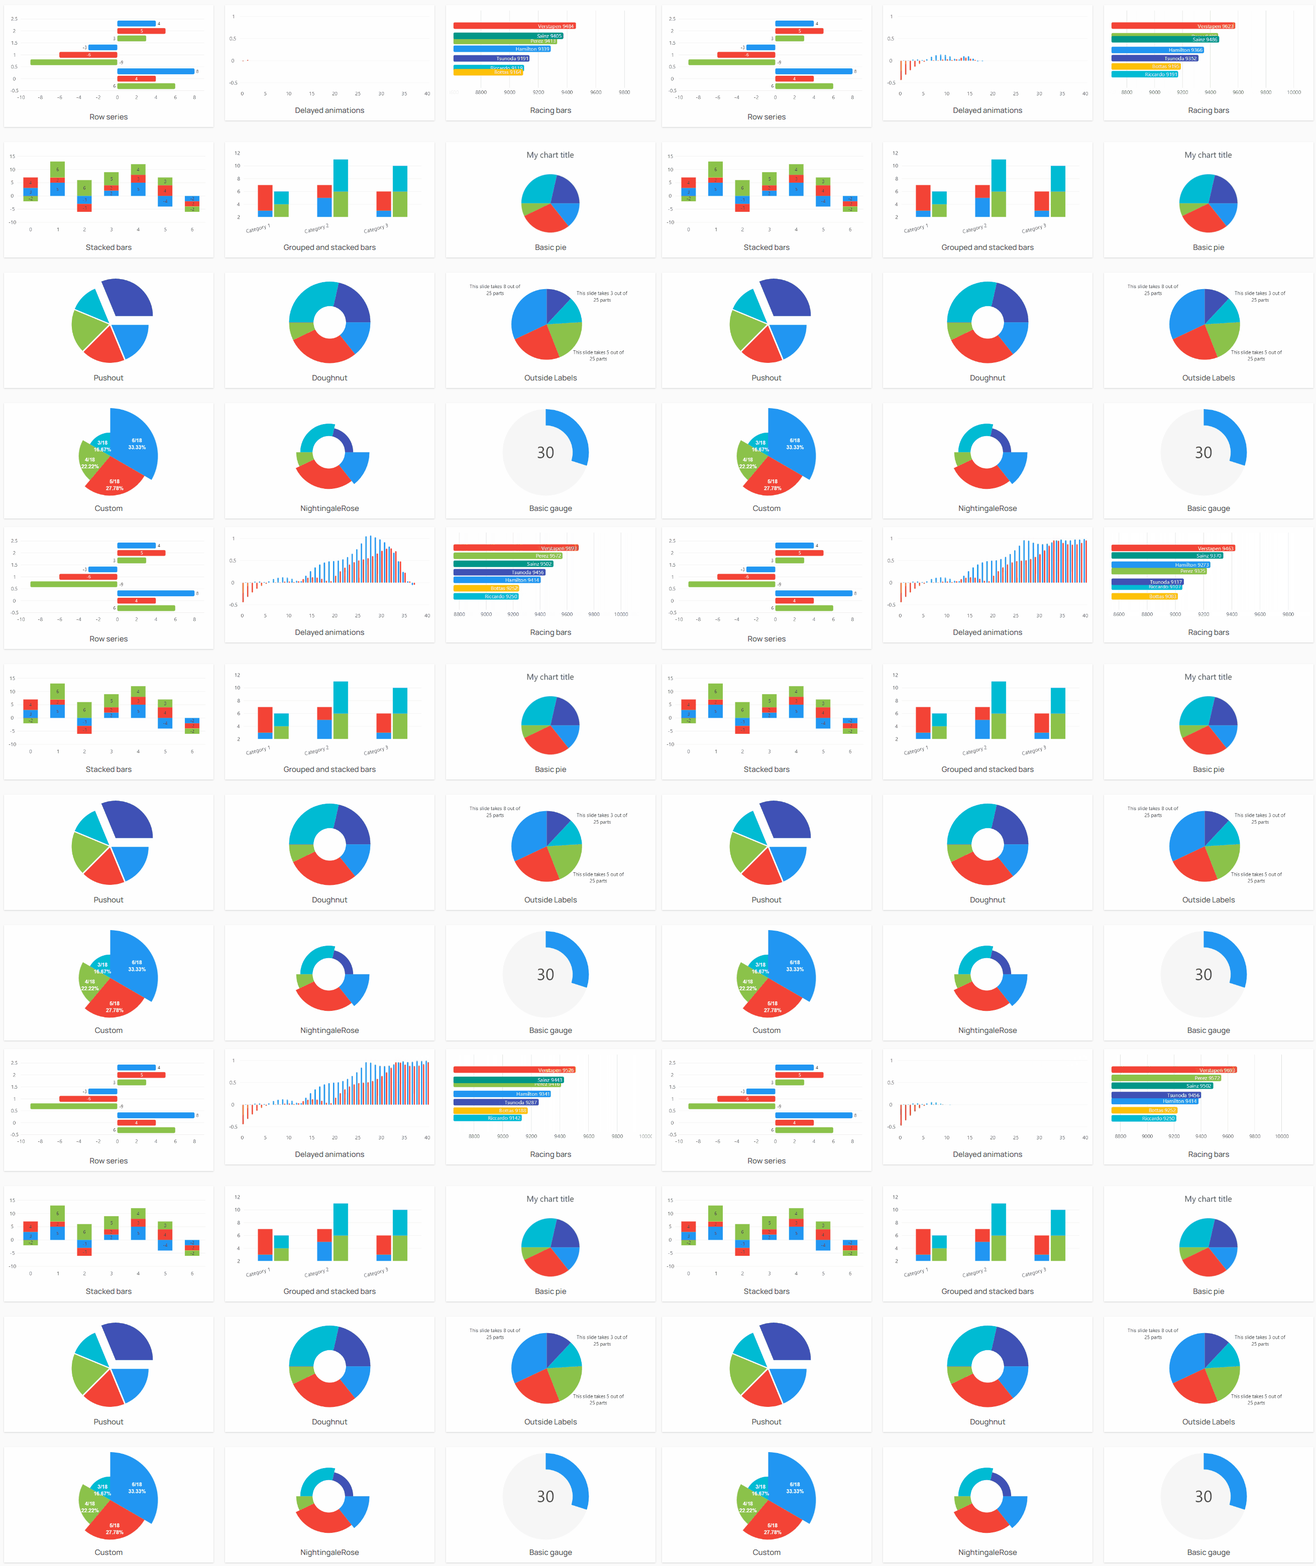
官方文档非常丰富,也有对应的示例,做出来的结果还是非常不错的。
部分效果 1:
部分效果 2:
部分效果 3:
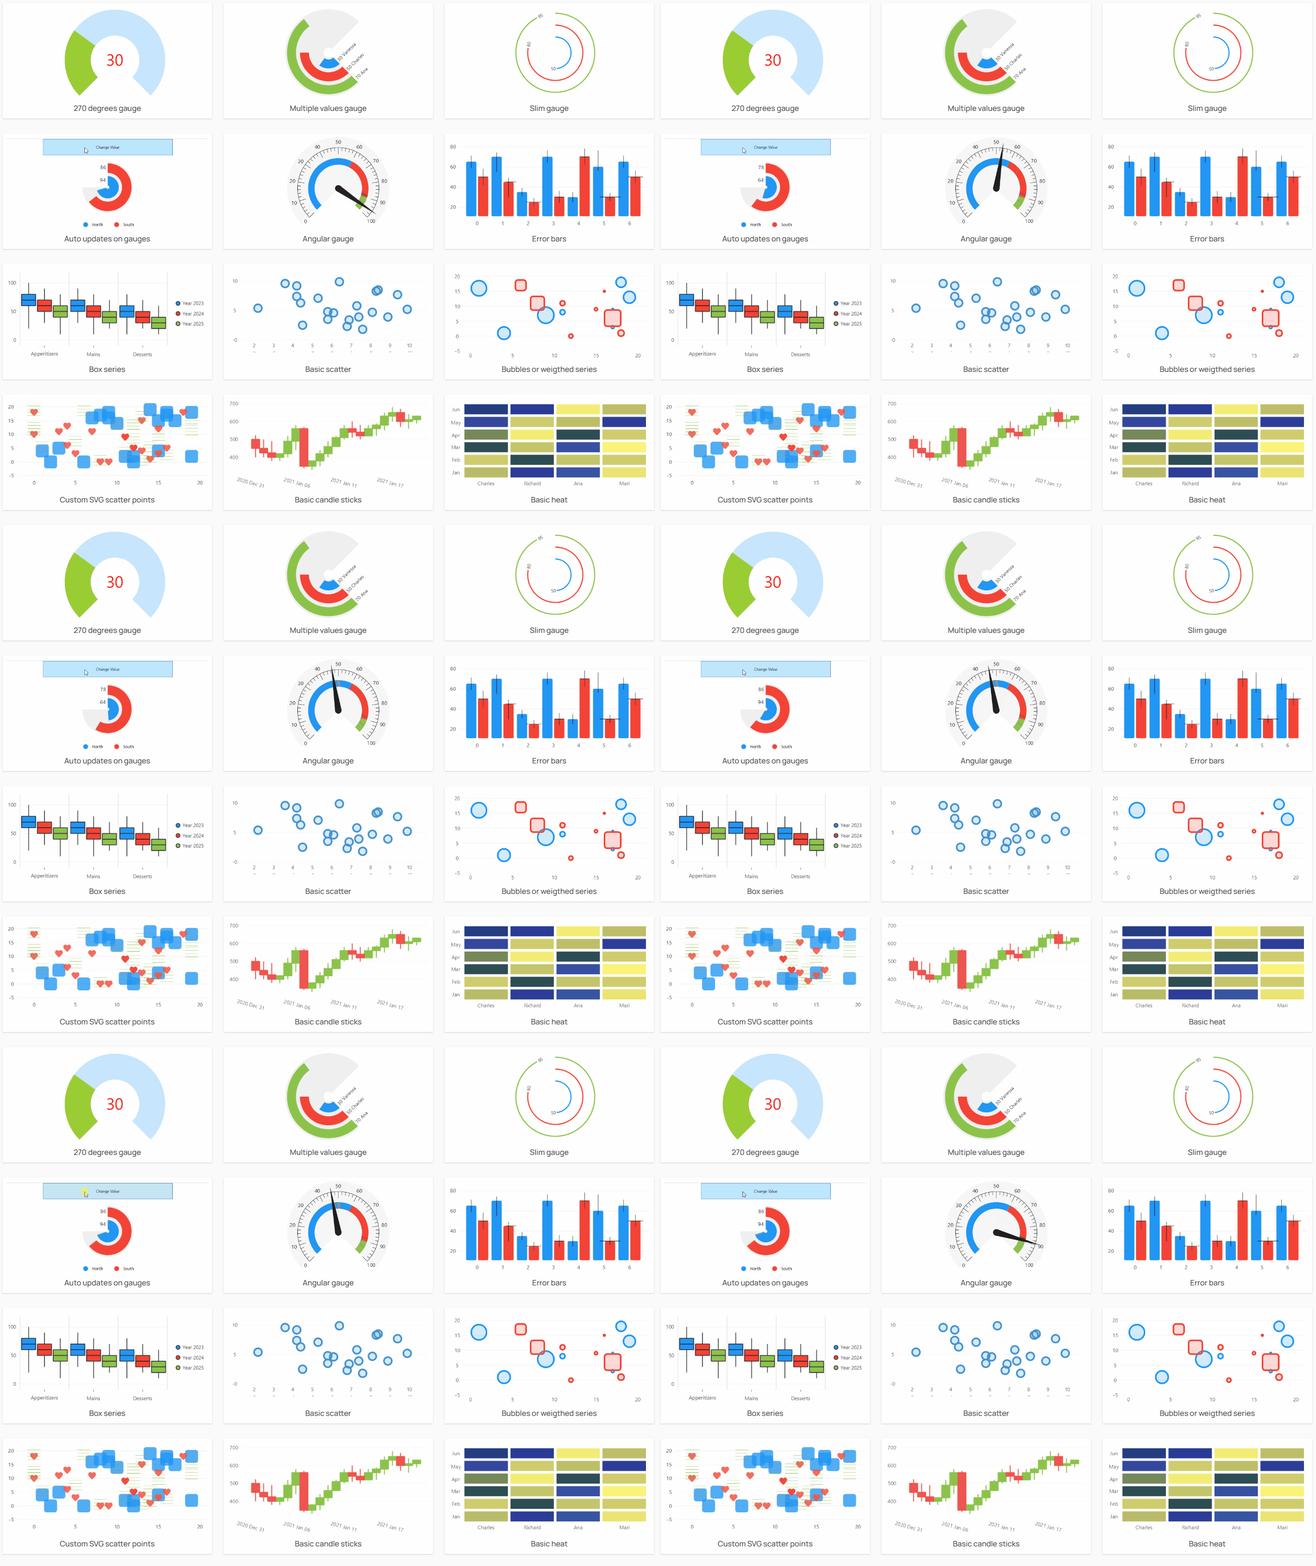
部分效果 4:
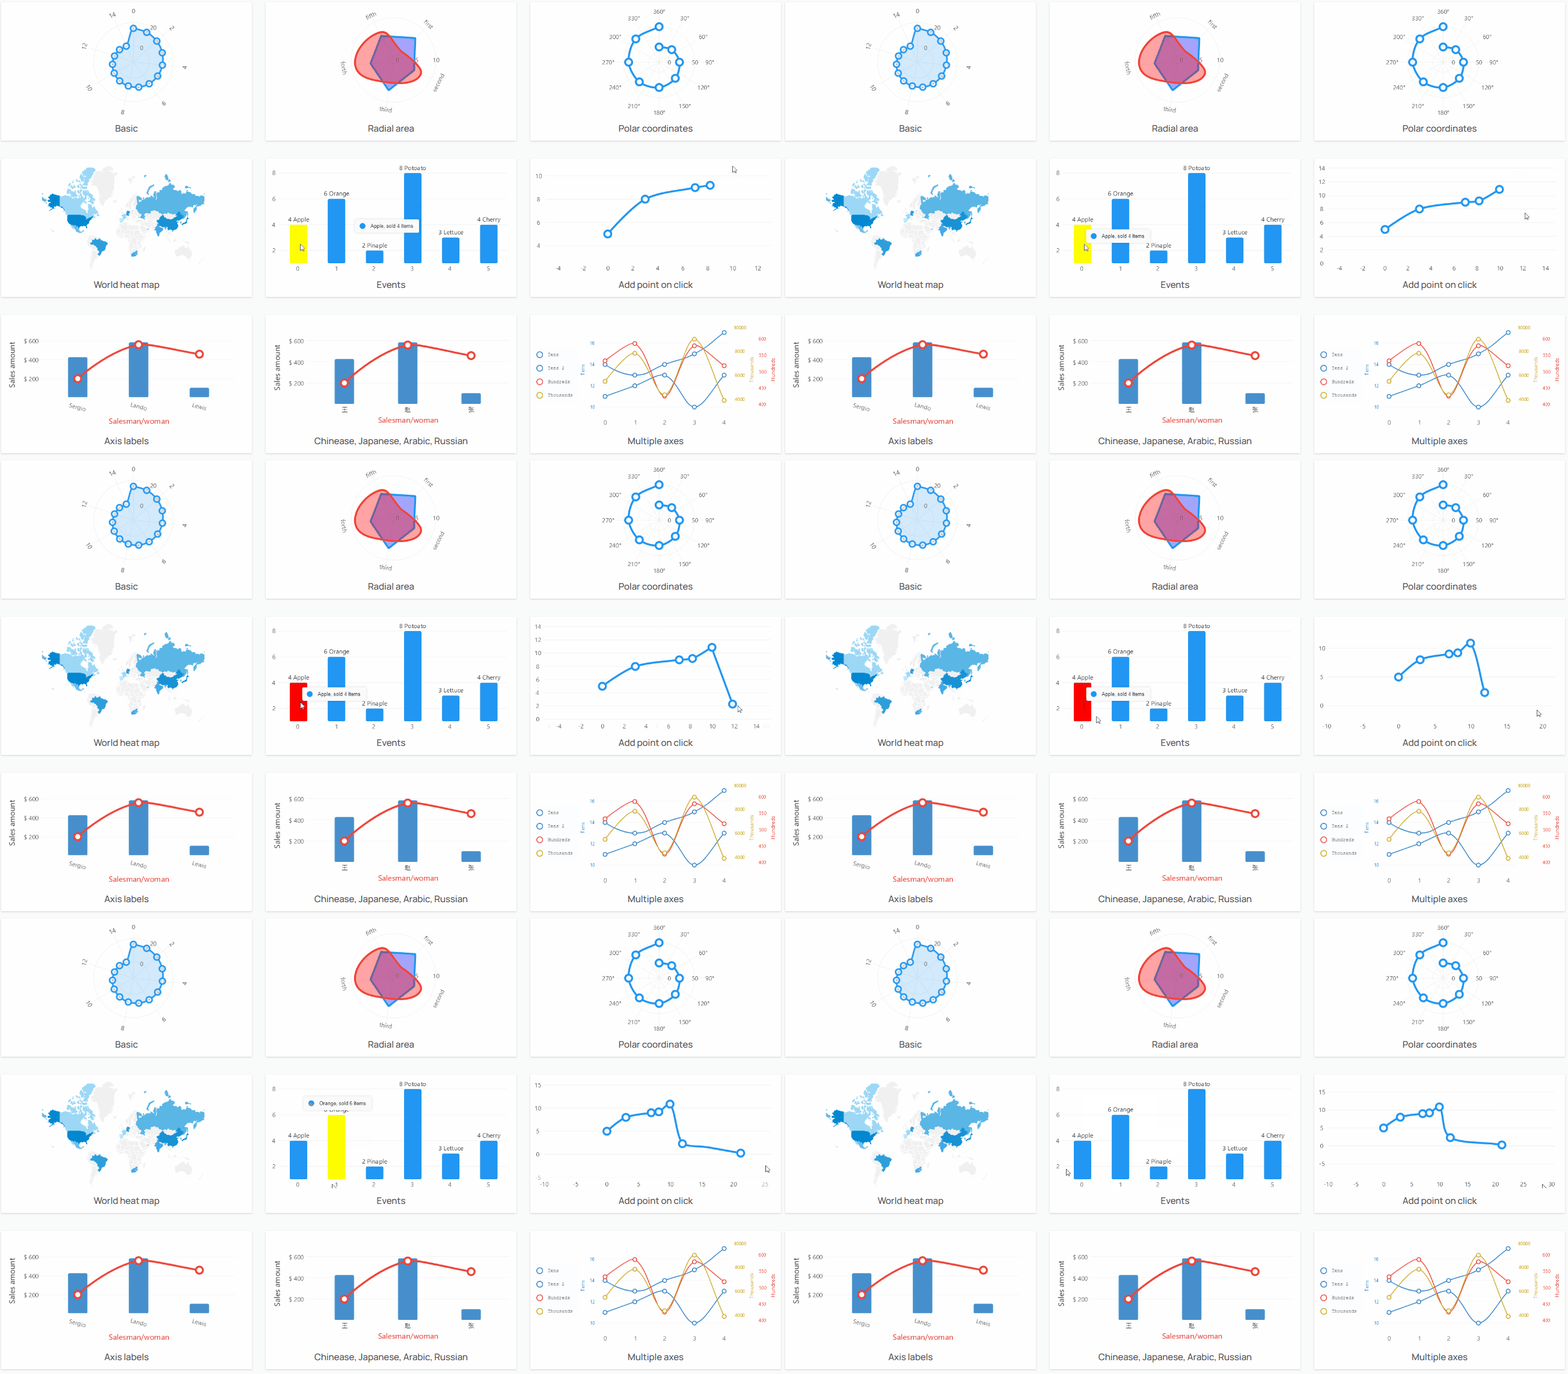
部分效果 5:
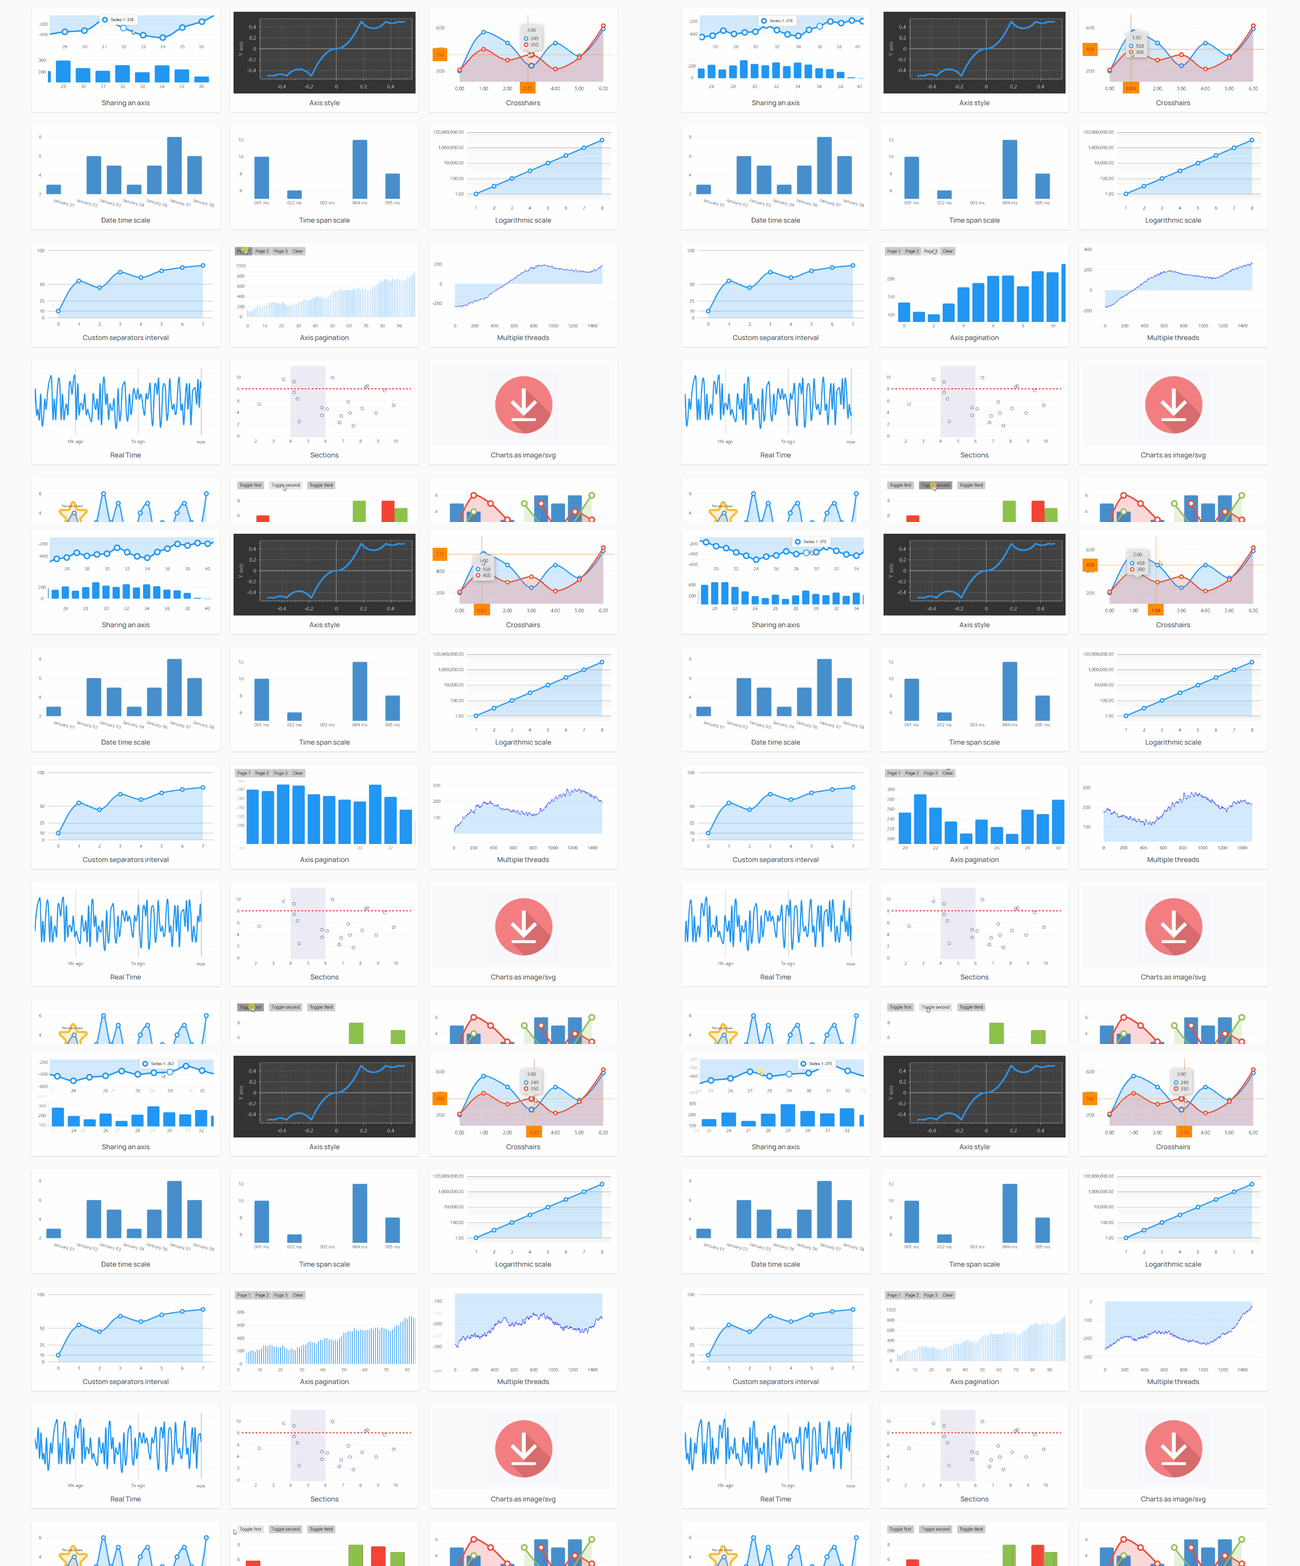
部分效果 6:
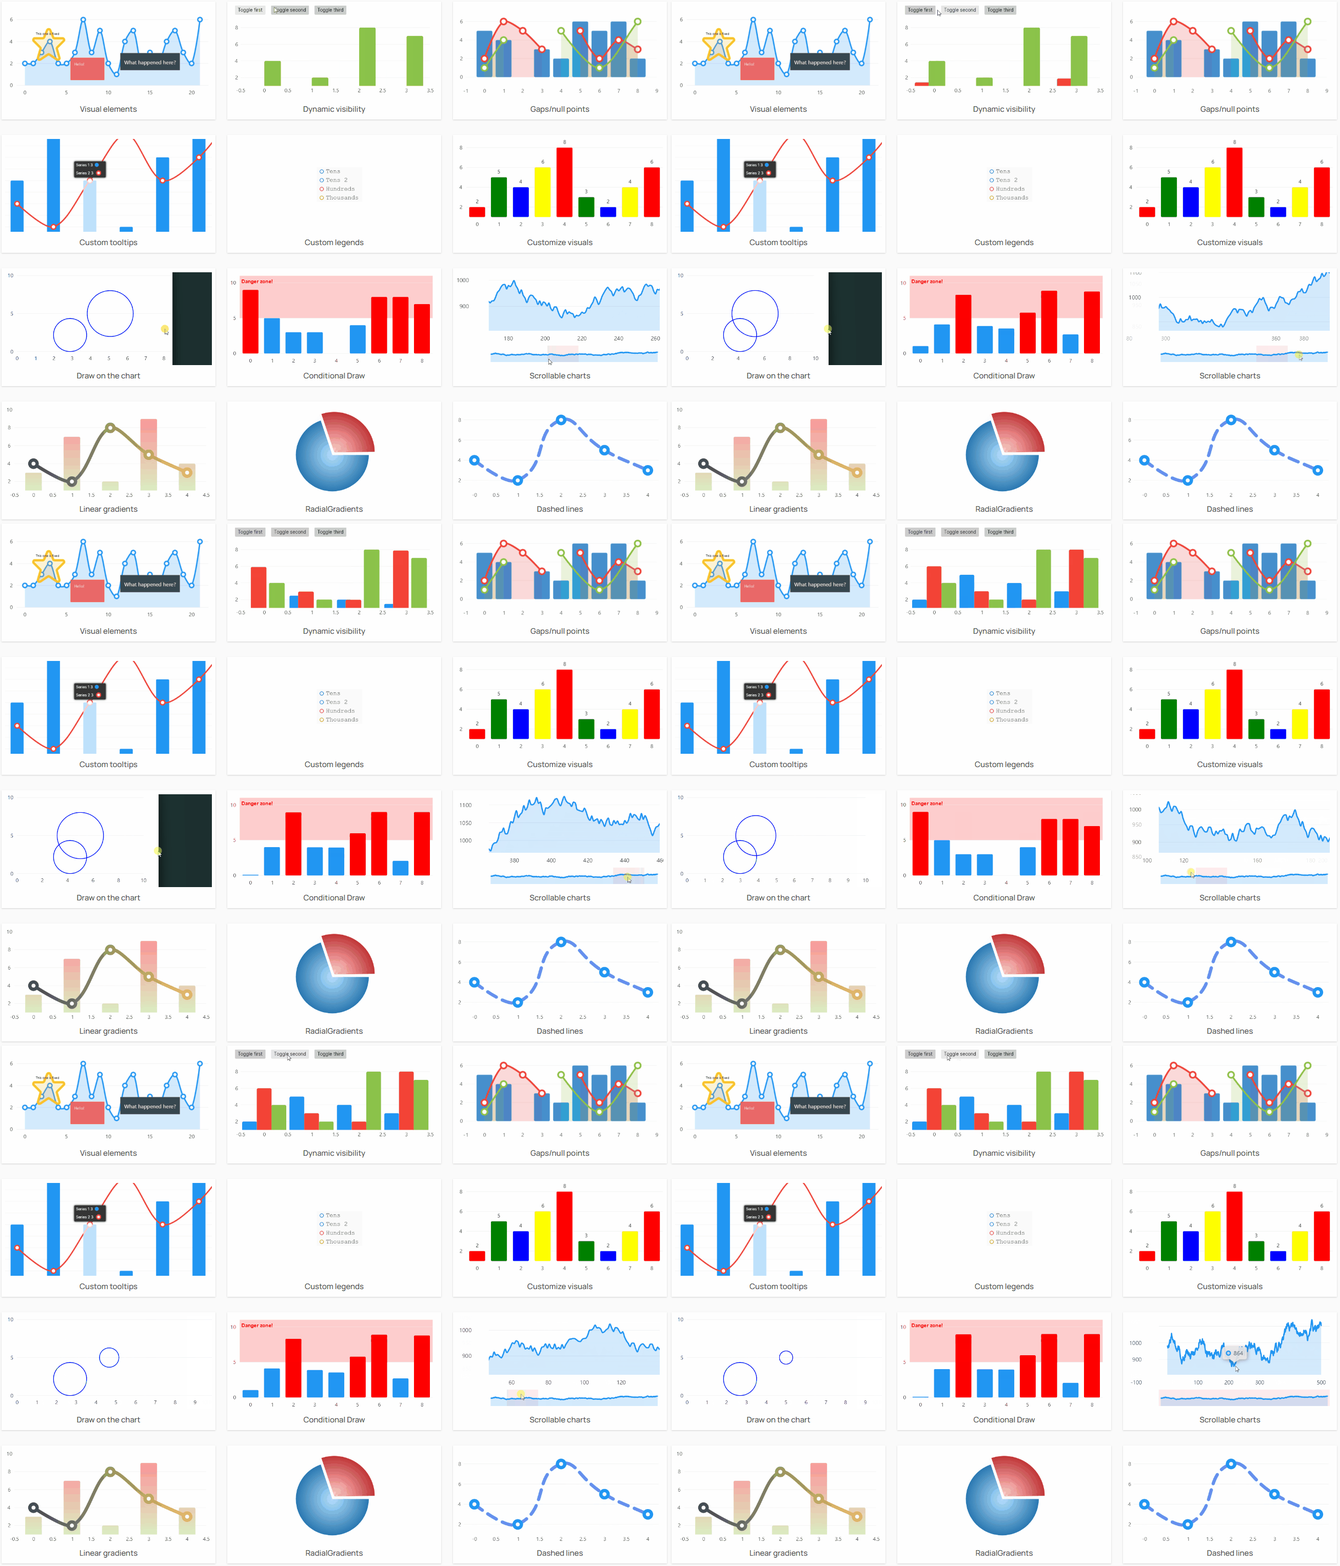
据说免费的LiveCharts在数据量超过 10000 渲染效果会不好,需要使用付费版。这个我还没有验证,读者可以自行尝试一下。