
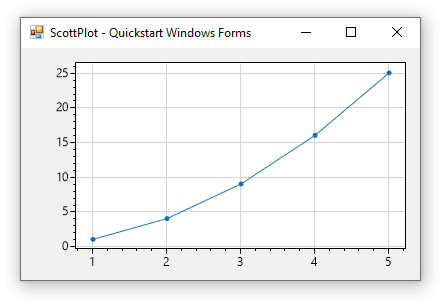
简介
ScottPlot是一个免费开源的数据可视化控件,使用C#语言编写。 它可以轻松实现海量数据可视化交互. ScottPlot Cookbook 例程中,教我们如何用几行代码创建线条图,直方图,饼状图,散点图。
ScottPlot Cookbooks学习如何使用ScottPlot。
ScottPlot Demo 看看ScottPlot能做什么。
Quickstart:
- Console Application
- Windows Forms
- WPF
- WinUI
- MAUI
- Uno Platform
- Avalonia
- Eto
- .NET Core API
- Blazor WASM
- PowerShell
- .NET Notebook
- IronPython

源码框架
用100w浮点数实测,使者如丝,图不欺我!太酷了吧!那我们赶紧来看看,这是怎么做到的呢?
下载源码:GitHub - ScottPlo
源码目录分析
打开下载好的源码,在scr中有两个版本,我们看稳定版的ScottPlot4(./ScottPlot/src/ScottPlot4/).(站长注:作者原文写于2022年,目前2024年10月31日5.X版本已上线1年多,可放心使用)
ScottPlot4的目录中有Winforms,WPF这些.NET架构的东西,可以把它们当做ScottPlot的一个外壳。
ScottPlot目录是此控件的核心目录。
以下是精简版的ScottPlot目录:
ScottPlot/
├── AxisLimits.cs
├── Coordinate.cs
├── Control
│   ├── Backend.cs
│   ├── Configuration.cs
│   ├── DisplayScale.cs
│   └── EventProcess
│       ├── EventFactory.cs
│       ├── Events
│       │   ├── RenderHighQuality.cs
│       │   └── RenderLowQuality.cs
│       ├── EventsProcessor.cs
│       └── IUIEvent.cs
├── Drawing
│   ├── Font.cs
│   ├── GDI.cs
│   ├── Palette.cs
│   └── Tools.cs
├── Plot
│   ├── Plot.Add.cs
│   ├── Plot.Axis.cs
│   ├── Plot.cs
│   ├── Plot.Obsolete.cs
│   └── Plot.Render.cs
├── PlotDimensions.cs
├── Plottable
│   ├── AxisLine.cs
│   ├── Image.cs
│   ├── IPlottable.cs
│   ├── MinMaxSearchStrategies
│   │   ├── IMinMaxSearchStrategy.cs
│   │   ├── LinearDoubleOnlyMinMaxStrategy.cs
│   │   ├── LinearFastDoubleMinMaxSearchStrategy.cs
│   │   ├── LinearMinMaxSearchStrategy.cs
│   │   └── SegmentedTreeMinMaxSearchStrategy.cs
│   ├── PiePlot.cs
│   ├── Polygon.cs
│   ├── ScatterPlot.cs
│   ├── SignalPlotBase.cs
│   ├── SignalPlot.cs
│   └──SignalPlotXY.cs
├── README.md
├── Renderable
│   ├── Axis.cs
│   ├── AxisDimensions.cs
│   ├── AxisLabel.cs
│   ├── AxisLine.cs
│   └── IRenderable.cs
基本概念
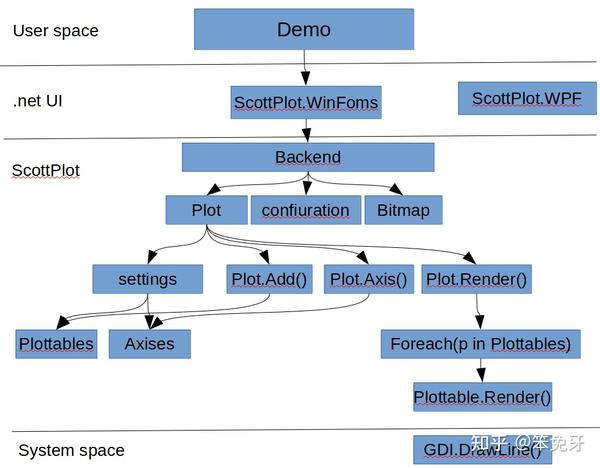
基于以上目录,从上到下顺序分析:
Control/Backend.cs   	   ----> 后台管理,数据,设置,事件相关
Drawing/GDI.cs		   ----> 底层绘图接口
Plot/Plot.cs    	   ----> 控件API,面向用户
Plottable/IPlottable.cs    ----> 可以绘制的组件
Renderable/IRenderable.cs  ----> 可以渲染的组件
由此看来ScottPlot目录的结构还是很清晰的。撑握了这些个基本概念,阅读源码就轻松多了。
来一张图总结:
源码分析入口点
因为Demo用的WinForm,所以我们看ScottPlot.WinForms/FromsPlot.cs,以此为源码分析的入口点。
class FormsPlot : UserControl
{
  public FormsPlot()
    {
        Backend = new Control.ControlBackEnd(1, 1, "FormsPlot");
        Backend.Resize(Width, Height, useDelayedRendering: false);
        Backend.BitmapChanged += new EventHandler(OnBitmapChanged);
        Backend.BitmapUpdated += new EventHandler(OnBitmapUpdated);
        Backend.CursorChanged += new EventHandler(OnCursorChanged);
        Backend.RightClicked += new EventHandler(OnRightClicked);
        Backend.LeftClicked += new EventHandler(OnLeftClicked);
        Backend.LeftClickedPlottable += new EventHandler(OnLeftClickedPlottable);
        Backend.AxesChanged += new EventHandler(OnAxesChanged);
        Backend.PlottableDragged += new EventHandler(OnPlottableDragged);
        Backend.PlottableDropped += new EventHandler(OnPlottableDropped);
        Configuration = Backend.Configuration;
    }
}
在FormsPlot构造时,创建后台管理Backend,并向Backend中注册代理事件,因此Backend的事件由FormsPlot来接管。配置也使用Backend中的配置。
后台管理
/Control/Backend.cs
public ControlBackEnd(float width, float height, string name = "UnamedControl")
{
    Cursor = Configuration.DefaultCursor; //鼠标样式
    EventFactory = new UIEventFactory(Configuration, Settings, Plot); //事件构造器
    EventsProcessor = new EventsProcessor(
        renderAction: (lowQuality) => Render(lowQuality),
        renderDelay: (int)Configuration.ScrollWheelZoomHighQualityDelay); //执行事件
    ControlName = name;
    Reset(width, height);// 此时是width = 1,height =1,主要用于创建Plot实例
}
/// <summary>
/// Reset the back-end by creating an entirely new plot of the given dimensions
/// </summary>
public void Reset(float width, float height) => Reset(width, height, new Plot());
在这个地方创建Plot实例,感觉还是有点奇怪。为了一张图片对多个Plot吗?知道的人留个言吧!
/Control/Backend.cs
public void Reset(float width, float height, Plot newPlot)
{
    Plot = newPlot;
    Settings = Plot.GetSettings(false);
    EventFactory = new UIEventFactory(Configuration, Settings, Plot);
    WasManuallyRendered = false;
    Resize(width, height, useDelayedRendering: false);
}
public void Resize(float width, float height, bool useDelayedRendering)
{
    // Disposing a Bitmap the GUI is displaying will cause an exception.
    // Keep track of old bitmaps so they can be disposed of later.
    OldBitmaps.Enqueue(Bmp);
    Bmp = new System.Drawing.Bitmap((int)width, (int)height);
    BitmapRenderCount = 0;

    if (useDelayedRendering)
        RenderRequest(RenderType.HighQualityDelayed);
    else
        Render();
}
创建用于绘图的Bitmap,之前的Bitmap被放入Old队列中. Bitmap大小是由FormsPlot构造时Backend.Resize()决定. 有了Bitmap之后就可以在上面绘图了。
ScottPlot组件
在看Render()这个函数实现前,还是先把关于绘制组件概念理解更深入一些。
Plot 控件API
Plot 为控件API,面向用户.
1)Plot构造
所有的配置都在settings里面
private readonly Settings settings = new Settings();
最终,用户设置都保存在Plot的settings中。
2) 设置x,y轴大小范围
/Plot/Plot.Axis.cs
public void SetAxisLimits(double? xMin = null, double? xMax = null,double? yMin = null,
    double? yMax = null,int xAxisIndex = 0, int yAxisIndex = 0)
{
     //1)Plot/Plot.cs的settings
     settings.AxisSet(xMin, xMax, yMin, yMax, xAxisIndex, yAxisIndex);
}
3) 增加一个Y轴信号
/Plot/Plot.Add.cs
public SignalPlot AddSignal(double[] ys, double sampleRate = 1, Color? color = null, string label = null)
{
    SignalPlot signal = new SignalPlot()
    {
        Ys = ys,
        SampleRate = sampleRate, //渲染时,将用到采样速度
        Color = color ?? settings.GetNextColor(),
        Label = label,

        // TODO: FIX THIS!!!
        MinRenderIndex = 0,
        MaxRenderIndex = ys.Length - 1,
    };
    Add(signal);
    return signal
}
public void Add(IPlottable plottable)
{
    settings.Plottables.Add(plottable);
}
此处的SignalPlot为一个Plottable对象,即把要显示的100w数据打包成可绘制的对象,
并调用Add()把此对象放入settings.Plottables中。settings.Plottables中存放所有要绘制的对象。
4) 渲染函数
/Plot/Plot.Render.cs
public interface IPlottable
{
    /// <summary>
    /// Controls whether the plot will be rendered and contribute to automatic axis limit detection
    /// </summary>
    bool IsVisible { get; set; }

    /// <summary>
    /// Index of the horizontal axis this plottable will use for coordinate/pixel conversions.
    /// 0 is the bottom axis, 1 is the top axis, and higher numbers are additional custom axes.
    /// </summary>
    int XAxisIndex { get; set; }

    /// <summary>
    /// Index of the vertical axis this plottable will use for coordinate/pixel conversions.
    /// 0 is the left axis, 1 is the right axis, and higher numbers are additional custom axes.
    /// </summary>
    int YAxisIndex { get; set; }

    /// <summary>
    /// This is called when it is time to draw the plottable on the canvas.
    /// </summary>
    /// <param name="dims">Spatial information about the plot and all axes to assist with coordinate/pixel conversions.</param>
    /// <param name="bmp">The image on which this plottable will be drawn.</param>
    /// <param name="lowQuality">If true, disable anti-aliased lines and text to achieve faster rendering.</param>
    void Render(PlotDimensions dims, System.Drawing.Bitmap bmp, bool lowQuality = false);
}
当更新Bitmap事件产生时,将通过Plot.Render.cs:RenderPlottables()函数, 调用settings.Plottables中所有对象的Render().
/Plot/Plot.Render.cs
private void RenderPlottables(Bitmap bmp, bool lowQuality, double scaleFactor)
{
    foreach (var plottable in settings.Plottables)
   {
      if (plottable.IsVisible == false)
           continue;
      plottable.Render(dims, bmp, lowQuality);
   }
 }
Renderable
public interface IRenderable
{
    bool IsVisible { get; set; }
    void Render(PlotDimensions dims, Bitmap bmp, bool lowQuality = false);
}
从接口定义可以看出,与IPlottable相似,很有可能是老代码。
SignalPlot渲染算法分析
如何将100w数据显示到图片上,且在鼠标移动放大时保持丝滑手感呢?其设计思想很简单,那就是对100w数据按x轴分辨率进行采样.
SignalPlot继承自SignalPlotBase,但未覆盖Render()。因此,当Plottable.Render()被调用,即调用SignalPlotbase的Render().
/Plottable/SignalPlotBase.cs
public virtual void Render(PlotDimensions dims, Bitmap bmp, bool lowQuality = false)
{
   //之前AddSignal()中初始化 _SamplePeriod = 1/SampleRata
   double dataSpanUnits = _Ys.Length * _SamplePeriod;
   double columnSpanUnits = dims.XSpan / dims.DataWidth;
   //x轴中每个间隔中包含的Y数据个数
   double columnPointCount = (columnSpanUnits / dataSpanUnits) * _Ys.Length;
   //OffsetX图片左上原点到数据显示区的偏移
   double offsetUnits = dims.XMin - OffsetX;
   double offsetPoints = offsetUnits / _SamplePeriod;
   int visibleIndex1 = (int)(offsetPoints);
   int visibleIndex2 = (int)(offsetPoints + columnPointCount * (dims.DataWidth + 1));
   int visiblePointCount = visibleIndex2 - visibleIndex1;
   //x轴中每个间隔中包含的点个数
   double pointsPerPixelColumn = visiblePointCount / dims.DataWidth;
   double dataWidthPx2 = visibleIndex2 - visibleIndex1 + 2;
   bool densityLevelsAvailable = DensityLevelCount > 0 && pointsPerPixelColumn > DensityLevelCount;
   double firstPointX = dims.GetPixelX(OffsetX);//转换成像素点
   double lastPointX = dims.GetPixelX(_SamplePeriod * (_Ys.Length - 1) + OffsetX);
   double dataWidthPx = lastPointX - firstPointX;
   double columnsWithData = Math.Min(dataWidthPx, dataWidthPx2);

   if (columnsWithData < 1 && Ys.Length > 1)
   {
      RenderSingleLine(dims, gfx, penHD);
    }
    else if (pointsPerPixelColumn > 1 && Ys.Length > 1)
    {
      if (densityLevelsAvailable)
          RenderHighDensityDistributionParallel(dims, gfx, offsetPoints, columnPointCount);
      else
	 //数据多的情况调用此函数
         RenderHighDensity(dims, gfx, offsetPoints, columnPointCount, penHD);
    }
    else
    {
        RenderLowDensity(dims, gfx, visibleIndex1, visibleIndex2, brush, penLD, penHD);
    }
}

private void RenderHighDensity(PlotDimensions dims, Graphics gfx, double offsetPoints, double columnPointCount, Pen penHD)
{
    int dataColumnFirst = (int)Math.Ceiling((-1 - offsetPoints + MinRenderIndex) / columnPointCount - 1);
    int dataColumnLast = (int)Math.Ceiling((MaxRenderIndex - offsetPoints) / columnPointCount);

    var columns = Enumerable.Range(dataColumnFirst, dataColumnLast - dataColumnFirst);

    //串行同步方式,对x轴每一列中的Y数据进行计算(取最大最小值)
    intervals = columns
          .Select(xPx => CalcInterval(xPx, offsetPoints, columnPointCount, dims));

    PointF[] linePoints = intervals
          .SelectMany(c => c.GetPoints())
          .ToArray();

    for (int i = 0; i < linePoints.Length; i++)
        linePoints[i].X += dims.DataOffsetX;

    if (linePoints.Length > 0)
    {
        ValidatePoints(linePoints);
        gfx.DrawLines(penHD, linePoints);
    }
}

//取最大值,最小值
private IntervalMinMax CalcInterval(int xPx, double offsetPoints, double columnPointCount, PlotDimensions dims)
{
    // get the min and max value for this column
    Strategy.MinMaxRangeQuery(index1, index2, out double lowestValue, out double highestValue);

    float yPxHigh = dims.GetPixelY(lowestValue + OffsetYAsDouble);
    float yPxLow = dims.GetPixelY(highestValue + OffsetYAsDouble);
    return new IntervalMinMax(xPx, yPxLow, yPxHigh);
}
用GetPoints()交替取最大值,最小值
private class IntervalMinMax
{
    public float x;
    public float Min;
    public float Max;
    public IntervalMinMax(float x, float Min, float Max)
    {
        this.x = x;
        this.Min = Min;
        this.Max = Max;
     }
    public IEnumerable<PointF> GetPoints()
    {
	//交替取最大值,最小
        yield return new PointF(x, Min);
        yield return new PointF(x, Max);
    }
}
查找最大最小值策略
源码中有三种策略,可以提前计算,也可动态计算。
/Plottable/MinMaxSearchStrategy/IMinMaxSearchStrategy.cs
public interface IMinMaxSearchStrategy<T>
{
    T[] SourceArray { get; set; }
    void MinMaxRangeQuery(int l, int r, out double lowestValue, out double highestValue);
    void updateElement(int index, T newValue);
    void updateRange(int from, int to, T[] newData, int fromData = 0);
    double SourceElement(int index);
}
/Plottable/MinMaxSearchStrategy/LinearDoubleOnlyMinMaxStrateg.cs
public void MinMaxRangeQuery(int l, int r, out double lowestValue, out double highestValue)
{
    lowestValue = sourceArray[l];
     highestValue = sourceArray[l];
     for (int i = l; i <= r; i++)
     {
	if (sourceArray[i] < lowestValue)
		lowestValue = sourceArray[i];
	if (sourceArray[i] > highestValue)
		highestValue = sourceArray[i];
      }
}
事件
不同的事件,执行不同的ProcessEvent()。和Plottable类型设计思想相同。
当检测到事件,用UIEventFactor中的方法构造相应的Event.
/Control/EventProcess/Events/IUIEvent.cs
public interface IUIEvent
{
   public RenderType RenderType { get; }
   void ProcessEvent();
}
/Control/EventProcess/Events/MouseZoomEvent.cs
public void ProcessEvent()
{
   float x = Input.ShiftDown ? Settings.MouseDownX : Input.X;
   float y = Input.CtrlDown ? Settings.MouseDownY : Input.Y;
   Settings.MouseZoom(x, y);
}
事件执行流程
首先,是FormsPlot.cs中PictureBox1接收鼠标事件。
然后,调用Backend.MouseMove().
最后,调用事件对应的ProcessEvent().
/ScottPlot.Winforms/FormsPlot.cs
private void PictureBox1_MouseMove(object sender, MouseEventArgs e)
{
    Backend.MouseMove(GetInputState(e)); base.OnMouseMove(e);
}
public void MouseMove(InputState input)
{
     mouseMoveEvent = EventFactory.CreateMouseZoom(input);
     ProcessEvent(mouseMoveEvent);
}
结束
ScottPlot是一款很棒的软件,可以解决大量数据显示问题,性能强悍。使用MIT 开源协议,真香!
之前在网上只搜索到ScottPlot介绍和使用的文章,没有源码分析.今天我来写一个ScottPlot源码分析,补充一下。
很少写文章,发现写源码析的文章还挺难的,不足之处请见谅!希望大家喜欢!
最后,感谢ScottPlot的贡献者们!