
在 winform blazor hybrid 中绘图
前几天跟大家介绍了在 winform 中使用 blazor hybrid,而且还说配上 blazor 的 ui 可以让我们的 winform 程序设计的更加好看,接下来我想以一个在 winform blazor hybrid 中绘图的例子来进行说明,希望对你有所帮助。
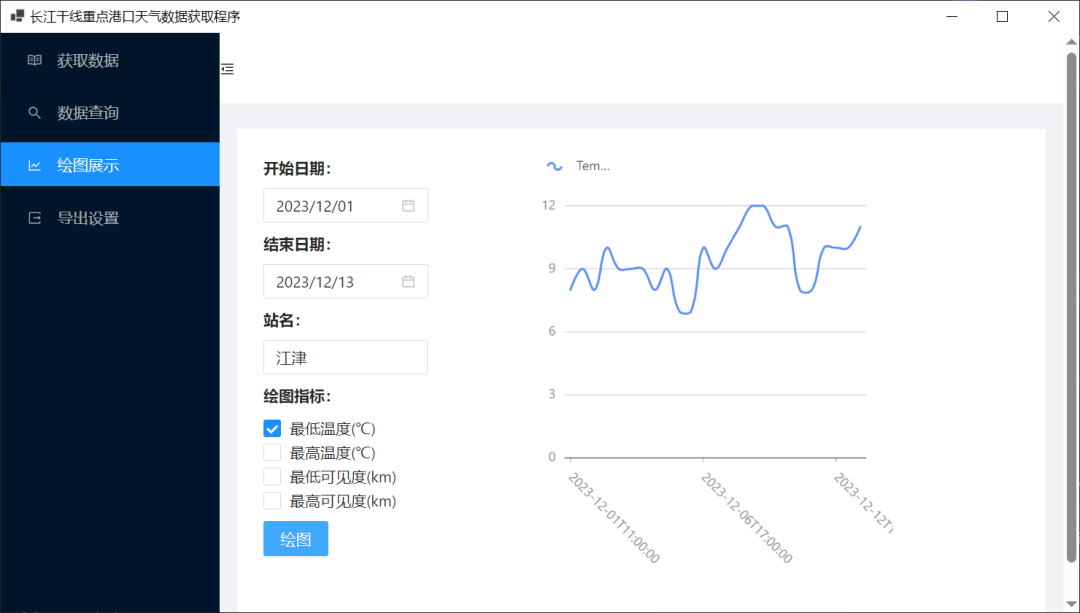
效果
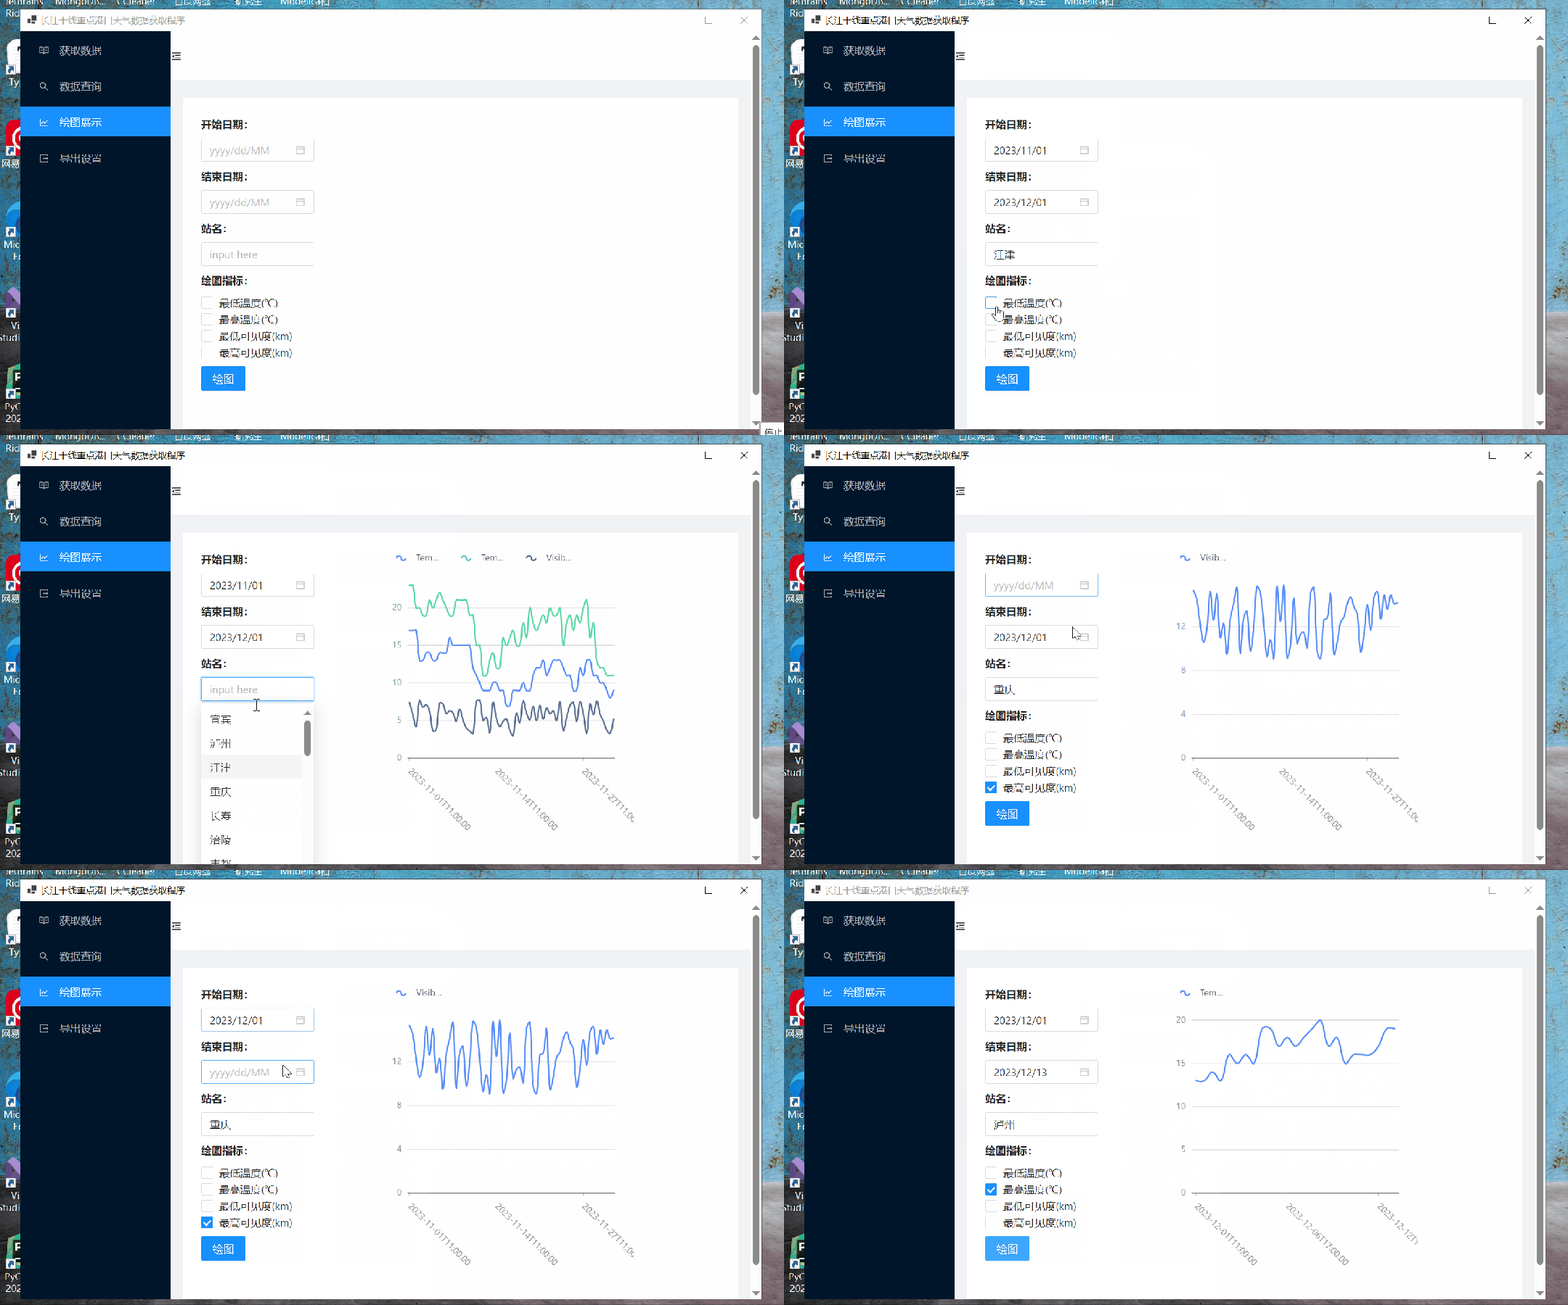
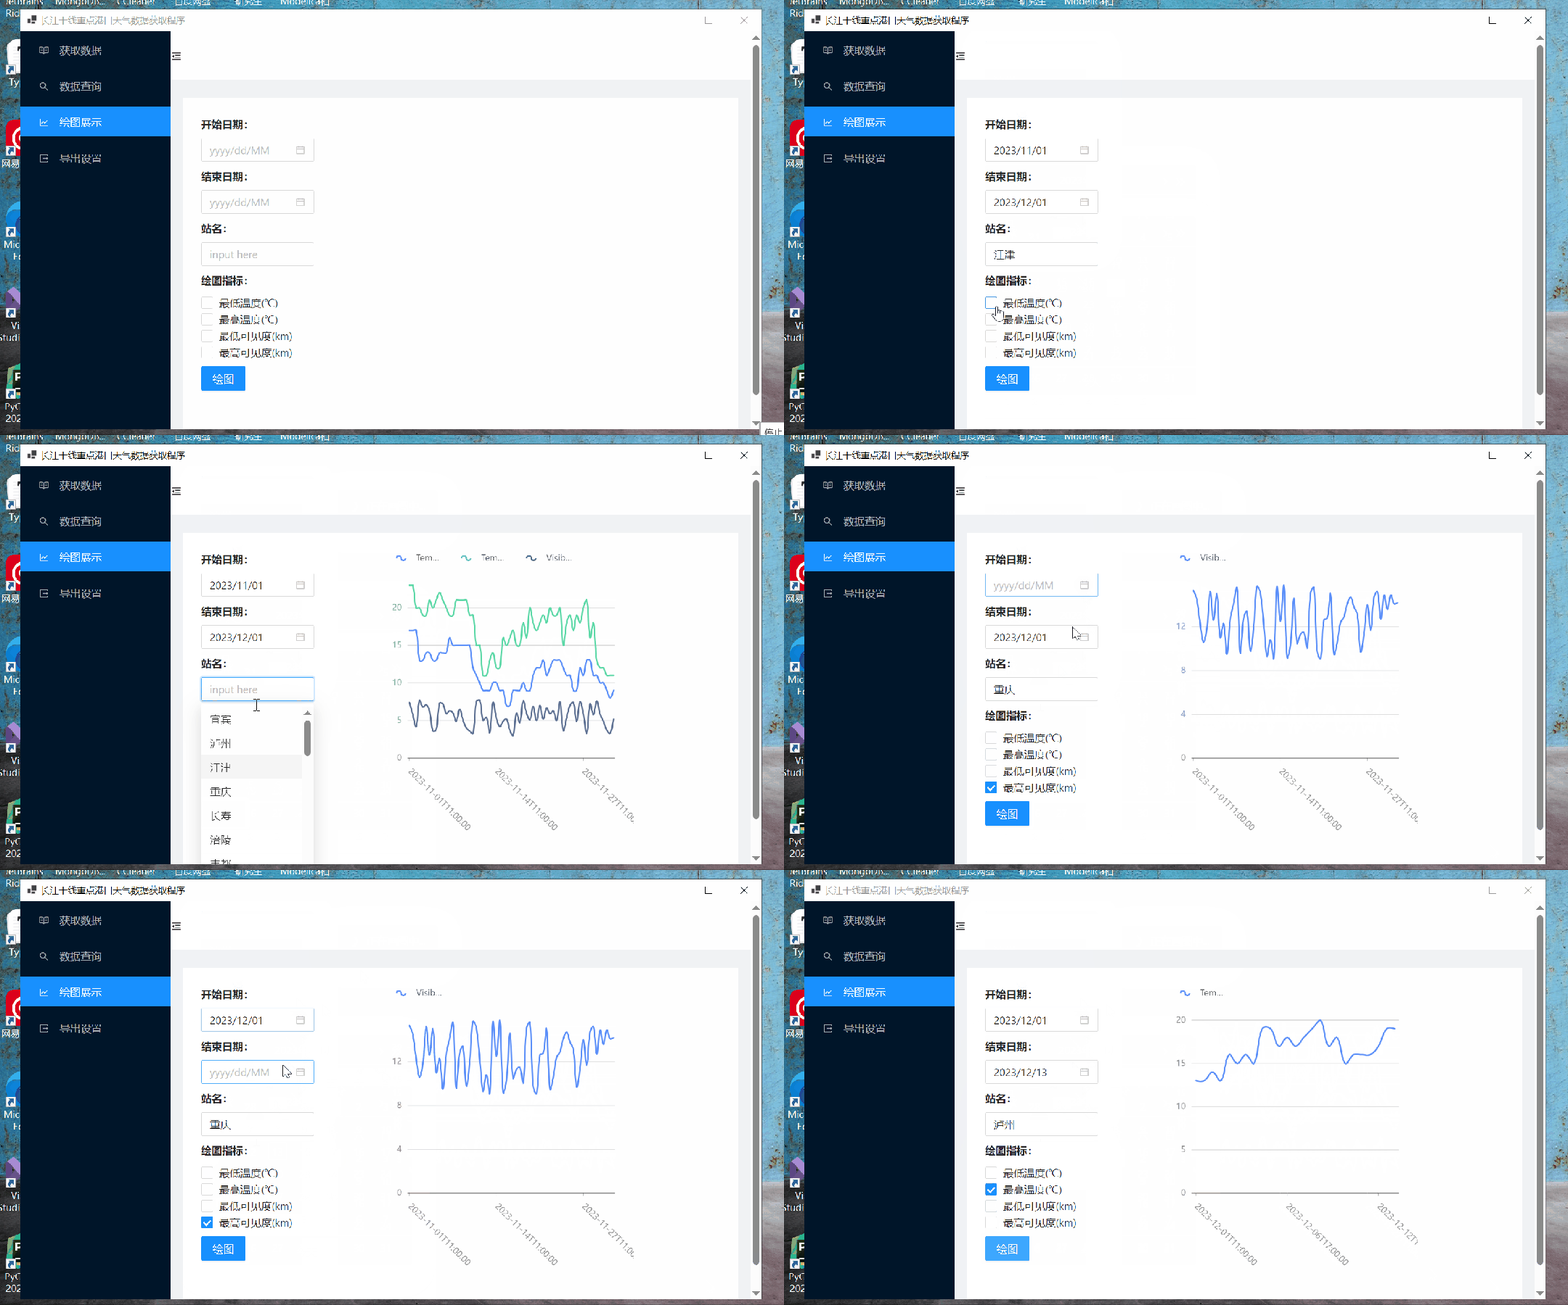
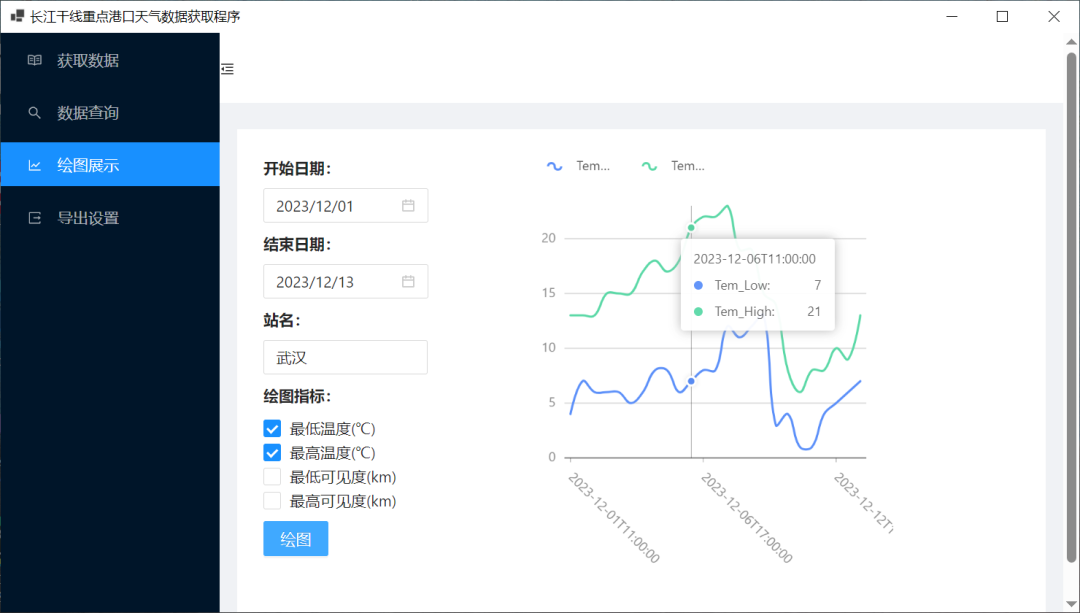
在开始之前,先给大家演示一下效果,如下所示:
具体实现
如果你对具体实现感兴趣,可以继续往下阅读。
1、引入 ant design blazor
该应用中用到的所有组件都来源于 ant design blazor。
在本文中我只介绍绘图部分的实现,首先需要在项目中引入 ant design blazor。
安装 NuGet 包引用,如下所示:
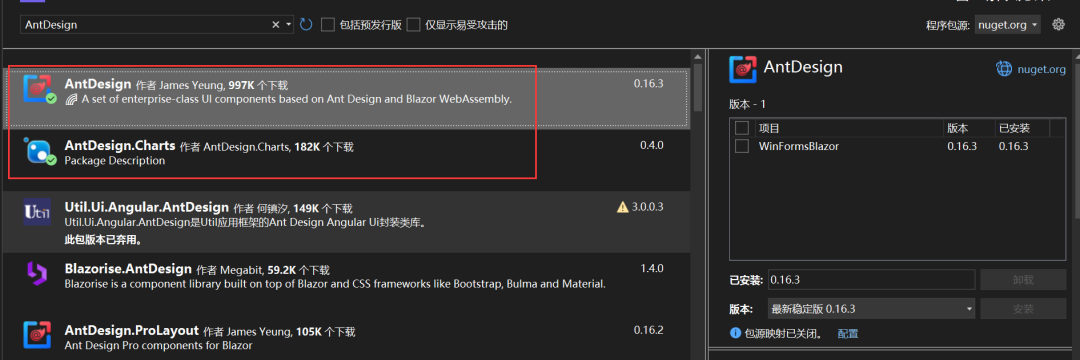
如果需要画图的话,还需要引用 AntDesign.Charts 包引用。
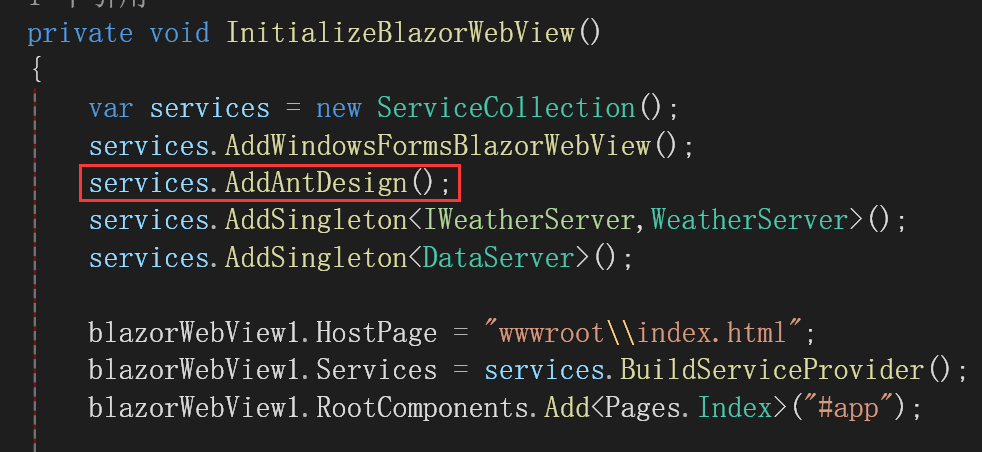
在项目的 Form1.cs 中注册相关服务:
services.AddAntDesign();
如下所示:
引入静态样式和脚本文件:
<link href="_content/AntDesign/css/ant-design-blazor.css" rel="stylesheet" />
<script src="_content/AntDesign/js/ant-design-blazor.js"></script>
winform blazor hybrid 项目在 wwwroot/index.html 中引入,如下所示:

这里我也把 AntDesign.Charts 的引入了。
在 _Imports.razor 中加入命名空间:
@using AntDesign
为了动态地显示弹出组件,需要在 App.razor 中添加一个 <AntContainer /> 组件。
这是官网的说法,在 winform blazor hybrid 中可以在当做主页面的 razor 中添加,我这里是 Index.razor 如下所示:
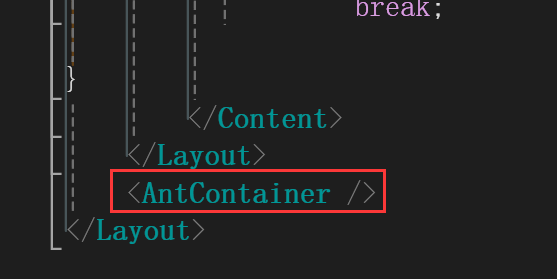
现在就可以使用 ant design blazor 的组件了。
2、页面设计
绘图页面的设计如下所示:
第一步选择喜欢的布局,我选的是官网中的这一款,如下所示:
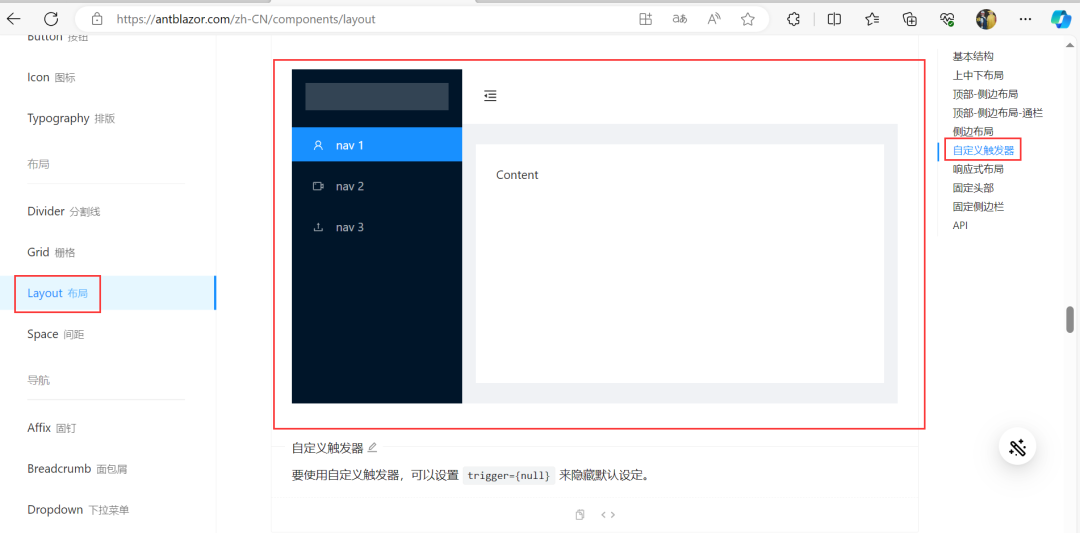
自己修改一下图标与名字,那么现在摆在面前的第一个问题就是,如何实现点击切换页面呢?
每一个 MenuItem 都有一个 Key 属性,如下所示:
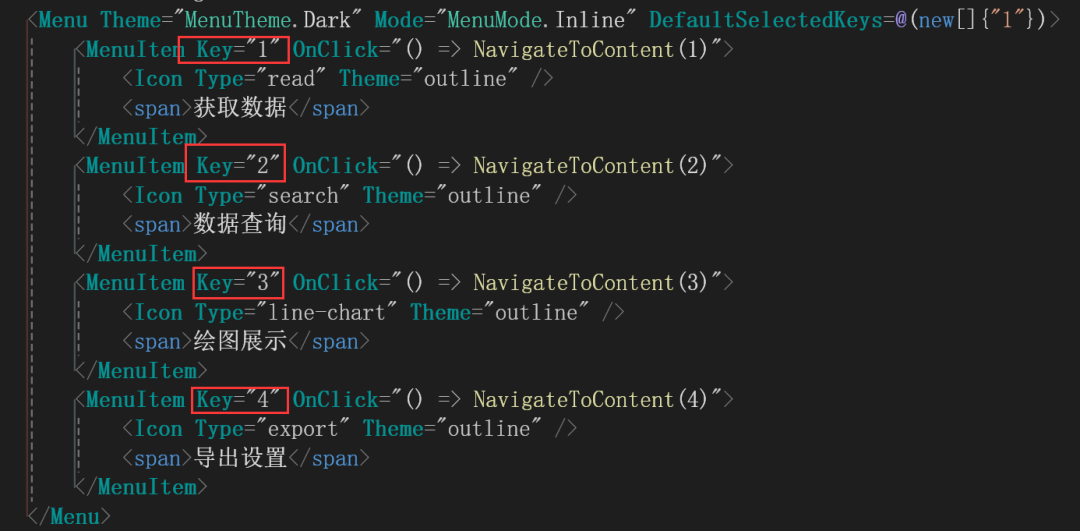
在这里每一个 Key 都是唯一的。点击不同的 MenuItem 都会触发点击事件,而点击事件使用了 lambda 表达式调用了同一个方法,但是参数不同。
现在来看看这个方法:
 int selectedMenuItem = 1;
 private void NavigateToContent(int menuItemNumber)
 {
     selectedMenuItem = menuItemNumber;
 }
很简单,只是将参数传给 selectedMenuItem。
然后在内容这个地方,使用 switch case:
<Content Class="site-layout-background" Style="margin: 24px 16px;padding: 24px;min-height: 450px;">
@switch(selectedMenuItem)
 {
   case 1:
    <GetData></GetData>
           break;
   case 2:
     <QueryData></QueryData>
           break;
   case 3:
      <Painting></Painting>
           break;
   case 4:
      <Export></Export>
           break;
 }
 </Content>
然后就可以根据不同的 selectedMenuItem 值显示不同的组件了。
现在来看看<Painting></Painting>组件的设计。
<Painting></Painting>组件的页面代码如下:
<div>
  <GridRow>
    <GridCol Span="8">
      <Space Direction="DirectionVHType.Vertical">
        <SpaceItem>
          <Text Strong>开始日期:</Text>
        </SpaceItem>
        <SpaceItem>
          <DatePicker TValue="DateTime?" Format="yyyy/MM/dd" Mask="yyyy/dd/MM"
          Placeholder="@("yyyy/dd/MM")" @bind-Value = "Date1"/>
        </SpaceItem>
        <SpaceItem>
          <Text Strong>结束日期:</Text>
        </SpaceItem>
        <SpaceItem>
          <DatePicker TValue="DateTime?" Format="yyyy/MM/dd" Mask="yyyy/dd/MM"
          Placeholder="@("yyyy/dd/MM")" @bind-Value = "Date2"/>
        </SpaceItem>
        <SpaceItem>
          <Text Strong>站名:</Text>
        </SpaceItem>
        <SpaceItem>
          <AutoComplete
            @bind-Value="@value"
            Options="@options"
            OnSelectionChange="OnSelectionChange"
            OnActiveChange="OnActiveChange"
            Placeholder="input here"
            Style="width:150px"
          />
        </SpaceItem>
        <SpaceItem>
          <Text Strong>绘图指标:</Text>
        </SpaceItem>
        <SpaceItem>
          <div>
            <AntDesign.CheckboxGroup
              Options="@ckeckAllOptions"
              @bind-Value="selectedValues"
            />
          </div>
        </SpaceItem>
        <SpaceItem>
          <button type="@ButtonType.Primary" OnClick="Painting_Clicked">
            绘图
          </button>
        </SpaceItem>
      </Space>
    </GridCol>
    <GridCol Span="12">
      <AntDesign.Charts.Line
        Data="@Data1"
        Config="Config1"
        @ref="lineChartRef"
      />
    </GridCol>
  </GridRow>
</div>
3、填充站名
当我们一打开这个组件,就有不同的站名了,如下所示:
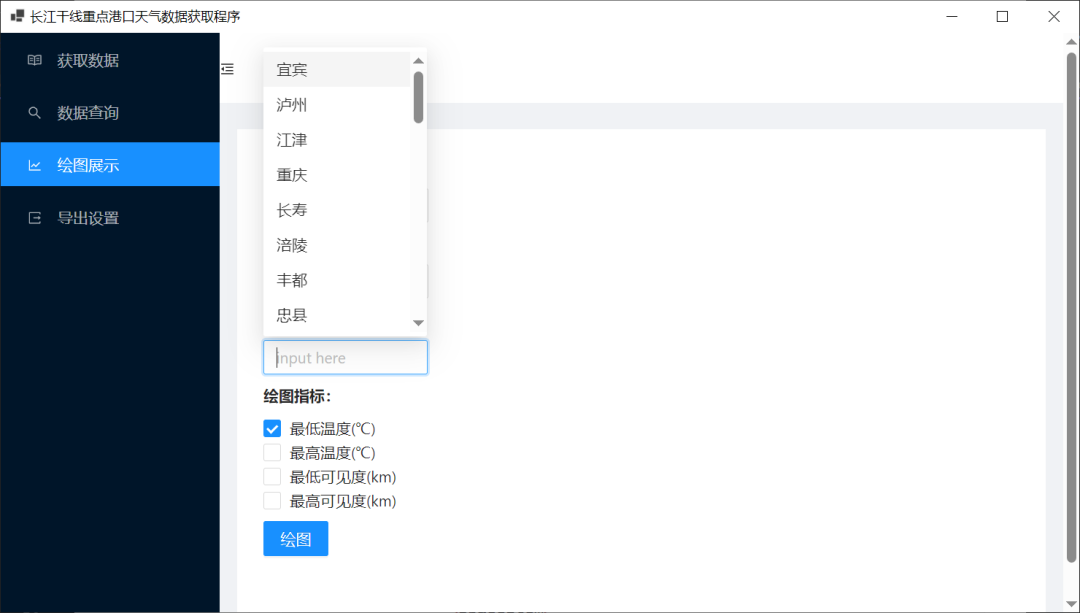
这是怎么实现的呢?
首先使用<AutoComplete>自动完成这个组件,如下所示:
<AutoComplete
  @bind-Value="@value"
  Options="@options"
  OnSelectionChange="OnSelectionChange"
  OnActiveChange="OnActiveChange"
  Placeholder="input here"
  Style="width:150px"
/>
List<string> options = new List<string>();
protected override void OnInitialized()
{
    options = weatherServer.GetDifferentStations();
}
在 Blazor 中,OnInitialized 是一个生命周期方法,用于在组件初始化时执行一些逻辑。具体而言,OnInitialized 方法是 Microsoft.AspNetCore.Components.ComponentBase 类中定义的一个虚拟方法,你可以在派生的组件中覆盖它,以在组件初始化的时候执行一些自定义的操作。
这里采用了三层架构的方式,分为 ui 层、业务逻辑层、数据库访问层。
其中的weatherServer是我自定义的服务,使用这个服务,需要在开头添加语句:
@inject IWeatherServer weatherServer;
在 Blazor 中,@inject 是用于在 Razor 页面或组件中注入服务的指令。通过 @inject,你可以将依赖注入服务引入到 Blazor 页面或组件中,以便在其中使用这些服务。
当然要使用服务,必须先注册服务:
services.AddSingleton<IWeatherServer,WeatherServer>();
services.AddSingleton<DataServer>();
这里一个是业务逻辑的服务一个是数据访问的服务。
其中IWeatherServer是业务逻辑层的接口,使用接口的好处,大家可以参考一下:
实现多继承:
C# 中的类只支持单一继承,但一个类可以实现多个接口。接口提供了一种方式,允许一个类在不同的维度上获取和实现功能。一个类可以实现多个接口,从而拥有每个接口定义的一组成员。
实现规范:
接口定义了一组规范,要求实现类提供特定的成员。这有助于强制实现类遵循一定的编程规范和标准,从而提高代码的一致性和可读性。
提供抽象和灵活性:
接口本身不提供具体的实现,只是定义了成员的契约。这使得接口成为一种强大的抽象工具,让你可以在不暴露具体实现的情况下描述类的能力。
接口还提供了一种扩展和修改类行为的方法,而无需更改类本身的实现。
实现依赖注入:
接口和依赖注入相结合,使得在应用程序中实现可替代性和可测试性变得更加容易。通过依赖注入框架,你可以在运行时注入不同的实现,从而实现模块之间的低耦合性。
定义公共契约:
接口提供了一种定义公共契约的方式,使得多个实现可以在系统中一起工作,而不管它们的具体类型如何。这对于插件系统、扩展性和模块化设计非常有用。
允许多态性:
通过接口,你可以利用 C# 中的多态性机制。当你引用一个对象的接口类型时,你可以在运行时实际上引用该对象的派生类型,从而实现多态行为。
**定义事件契约:**接口可以包含事件声明,用于定义类应该提供的事件契约。这有助于规范化事件的使用和处理。
我这里使用接口,主要是为了明晰服务到底实现了哪些功能,因为具体实现类中会有很多代码,不好看清楚。
比如跟绘图相关的接口如下所示:
public List<string> GetDifferentStations();
 public List<WeatherData> GetDataByCondition(Condition condition);
然后在实现类中进行具体实现:
 public List<string> GetDifferentStations()
 {
     return dataService.GetDifferentStations();
 }


 public List<WeatherData> GetDataByCondition(Condition condition)
 {
     return dataService.GetDataByCondition(condition);
 }
业务逻辑层中不与数据库直接相互,使用了数据库访问服务:
public List<string> GetDifferentStations()
 {
    return db.Queryable<WeatherData>().Select(x => x.StationName ?? "").Distinct().ToList();
 }
 public List<WeatherData> GetDataByCondition(Condition condition)
 {
     return db.Queryable<WeatherData>()
              .Where(x => x.Date >= condition.StartDate &&
                          x.Date < condition.EndDate.AddDays(1) &&
                          x.StationName == condition.StationName).ToList();
 }
这里数据库使用的是 SQLite,ORM 使用的是 SQLSugar,具体怎么设置,在这里我就不详细说明了,可以查看官网也可以查看历史文章。
4、绘图的实现
代码如下:
async void Painting_Clicked()
{
    if (Date1 != null && Date2 != null && value != null && selectedValues != null)
    {
        if(Data1?.Length > 0)
        {
            Data1 = new object[0];
        }
        if (plotDatas.Count > 0)
        {
            plotDatas.Clear();
        }
        var cofig = new MessageConfig()
            {
                Content = "正在画图中...",
                Duration = 0
            };
        var task = _message.Loading(cofig);
        var condition = new Condition();
        condition.StartDate = (DateTime)Date1;
        condition.EndDate = (DateTime)Date2;
        condition.StationName = value;
        for(int i = 0;i < selectedValues.Length;i ++)
        {
            switch (selectedValues[i])
            {
                case "Tem_Low":
                    var result1 = weatherServer.GetDataByCondition(condition).Select(x => new PlotData
                    {
                        Date = x.Date,
                        Type = "Tem_Low",
                        Value = Convert.ToDouble(x.Tem_Low)
                    }).ToList();
                    plotDatas.AddRange(result1);
                    break;
                case "Tem_High":
                    var result2 = weatherServer.GetDataByCondition(condition).Select(x => new PlotData
                        {
                            Date = x.Date,
                            Type = "Tem_High",
                            Value = Convert.ToDouble(x.Tem_High)
                        }).ToList();
                    plotDatas.AddRange(result2);
                    break;
                case "Visibility_Low":
                    var result3 = weatherServer.GetDataByCondition(condition).Select(x => new PlotData
                        {
                            Date = x.Date,
                            Type = "Visibility_Low",
                            Value = Convert.ToDouble(x.Visibility_Low)
                        }).ToList();
                    plotDatas.AddRange(result3);
                    break;
                case "Visibility_High":
                    var result4 = weatherServer.GetDataByCondition(condition).Select(x => new PlotData
                        {
                            Date = x.Date,
                            Type = "Visibility_High",
                            Value = Convert.ToDouble(x.Visibility_High)
                        }).ToList();
                    plotDatas.AddRange(result4);
                    break;

            }
        }

        // 将自定义类型的数组投影为 object[] 类型的数组
        Data1 = plotDatas.Select(p => new { date = p.Date, type = p.Type, value = p.Value }).ToArray();

        // 更新图表数据
        await lineChartRef.ChangeData(Data1);
        task.Start();
    }
    else
    {
        await _message.Error("请查看开始日期、结束日期、站名与绘图指标是否都已选择!!!");
    }
}
在 AntDesign.Charts 中画多条折线图,官网位置如下所示:
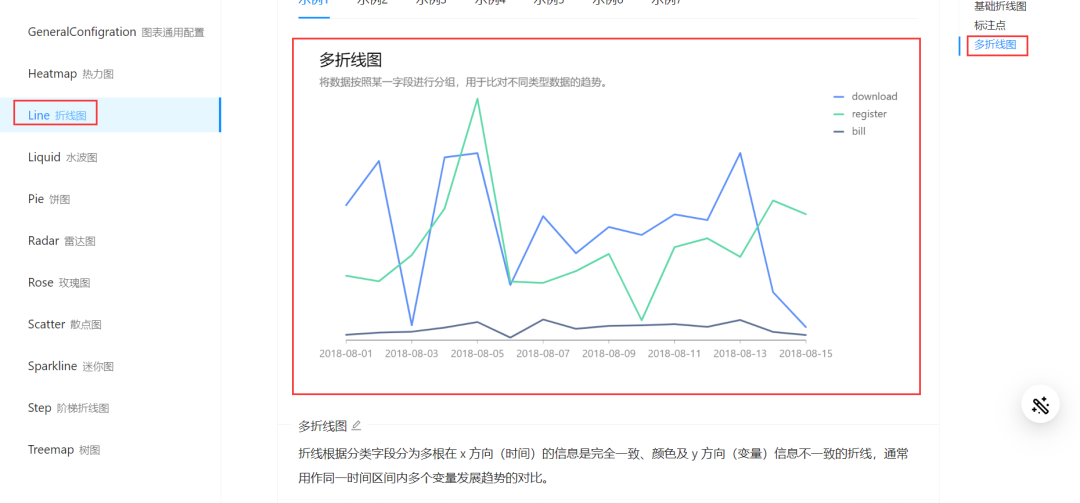
创建一个自定义的画图数据类:
public class PlotData
 {
     public DateTime? Date {  get; set; }
     public string? Type { get; set; }
     public double Value { get; set; }
 }
然后建一个画图数据类的列表:
List<PlotData> plotDatas = new List<PlotData>();
创建一个自定义的条件类:
 public class Condition
  {
      public DateTime StartDate{ get; set; }
      public DateTime EndDate { get; set; }
      public string? StationName { get; set; }
  }
然后在我点击的时候,如果各项不为空,那么创建一个条件对象:
var condition = new Condition();
condition.StartDate = (DateTime)Date1;
condition.EndDate = (DateTime)Date2;
condition.StationName = value;
该对象包含了我们选择的开始时间、结束时间与站名。
然后遍历 selectedValues:
for(int i = 0;i < selectedValues.Length;i ++)
selectedValues 是 string[]?类型。
string[]? selectedValues;
表示的是多选框中选中的值。
static CheckboxOption[] ckeckAllOptions = new CheckboxOption[]{
     new CheckboxOption{ Label="最低温度(℃)",Value="Tem_Low" },
     new CheckboxOption{ Label="最高温度(℃)", Value="Tem_High" },
     new CheckboxOption{ Label="最低可见度(km)", Value="Visibility_Low"},
     new CheckboxOption{ Label="最高可见度(km)", Value="Visibility_High" },
 };
选择的 Label 都有对应的 value。
 switch (selectedValues[i])
 {
     case "Tem_Low":
         var result1 = weatherServer.GetDataByCondition(condition).Select(x => new PlotData
         {
             Date = x.Date,
             Type = "Tem_Low",
             Value = Convert.ToDouble(x.Tem_Low)
         }).ToList();
         plotDatas.AddRange(result1);
         break;
     case "Tem_High":
         var result2 = weatherServer.GetDataByCondition(condition).Select(x => new PlotData
             {
                 Date = x.Date,
                 Type = "Tem_High",
                 Value = Convert.ToDouble(x.Tem_High)
             }).ToList();
         plotDatas.AddRange(result2);
         break;
     case "Visibility_Low":
         var result3 = weatherServer.GetDataByCondition(condition).Select(x => new PlotData
             {
                 Date = x.Date,
                 Type = "Visibility_Low",
                 Value = Convert.ToDouble(x.Visibility_Low)
             }).ToList();
         plotDatas.AddRange(result3);
         break;
     case "Visibility_High":
         var result4 = weatherServer.GetDataByCondition(condition).Select(x => new PlotData
             {
                 Date = x.Date,
                 Type = "Visibility_High",
                 Value = Convert.ToDouble(x.Visibility_High)
             }).ToList();
         plotDatas.AddRange(result4);
         break;
 }
如果值为Tem_Low,那么我们的画图数据就是:
var result2 = weatherServer.GetDataByCondition(condition).Select(x => new PlotData
             {
                 Date = x.Date,
                 Type = "Tem_High",
                 Value = Convert.ToDouble(x.Tem_High)
             }).ToList();
这里首先 weatherServer.GetDataByCondition(condition)的实现如下:
 public List<WeatherData> GetDataByCondition(Condition condition)
 {
     return dataService.GetDataByCondition(condition);
 }
而 dataService.GetDataByCondition(condition)的实现如下:
 public List<WeatherData> GetDataByCondition(Condition condition)
 {
     return db.Queryable<WeatherData>()
              .Where(x => x.Date >= condition.StartDate &&
                          x.Date < condition.EndDate.AddDays(1) &&
                          x.StationName ==                condition.StationName).ToList();
 }
最终获得了满足日期与站名要求的List<WeatherData>,然后再使用 Select 方法构造 PlotData 对象:
Select(x => new PlotData
             {
                 Date = x.Date,
                 Type = "Tem_High",
                 Value = Convert.ToDouble(x.Tem_High)
             }).ToList();
然后加入到 plotDatas 中:
plotDatas.AddRange(result1);
这样遍历完 selectedValues 之后就得到了我们所有需要的画图数据,选中了几项就有几项,然后需要映射到 object[] 类型的数组:
object[]? Data1;
 // 将自定义类型的数组投影为 object[] 类型的数组
 Data1 = plotDatas.Select(p => new { date = p.Date, type = p.Type, value = p.Value }).ToArray();
这里我也很迷惑,Ant Design Charts Blazor 的 AntLineChart 等组件通常使用 object[] 类型的数组作为图表的数据源。这是因为 JavaScript 本身是一种弱类型语言,而 Blazor 通过 JavaScript Interop 进行与 JavaScript 的通信,这是 ChatGPT 的解释,大家可以参考一下。
然后更新图表:
// 更新图表数据
await lineChartRef.ChangeData(Data1);
绘图的设置:
LineConfig Config1 = new LineConfig
{
    Padding = "auto",
    XField = "date",
    YField = "value",
    SeriesField = "type",
    Smooth = true
};
然后就可以实现绘图了。
小结
这是我第一次尝试使用 winform blazor hybrid 写一个小案例,blazor hybrid 也才刚开始了解,不足之处,请各位多多包涵,最后希望对你有所帮助。