
As a programmer, even if you possess the Monkey King's 72 transformations, you still can't escape Guanyin's headband; encountering bugs in programs is a common occurrence, but the ability to solve problems highlights your position in the company. This article compiles some god-like debugging techniques from my own practical experience in daily development. I hope it can serve as a reference and inspiration for all experts. If there are any mistakes, please point them out.
Author's Introduction
Hello everyone, I'm Riverside Corner, an old frontend developer. I'm usually busy with work and don't publish articles often. I hope every summary can help friends from all walks of life.
Frontend Novice
I've produced quite a few courses and have over a dozen student groups. I've met too many students who, when encountering a problem, directly @me in the group: My page isn't showing, please help me check. My code is exactly like yours, but it doesn't work. There's a console error, what should I do? How do I set breakpoints? How to debug code?
To be honest, I feel helpless, but I totally understand them. They are fresh graduates, like a blank sheet of paper, with no work experience. Their understanding of this industry is still at a low level. So whenever they encounter problems, I not only help them troubleshoot but also hope to gradually develop their ability and methods to solve problems on their own.
Frontend Rookie
The console Method
Everyone must be familiar with this. When encountering problems, you can output logs using console to analyze the issue.
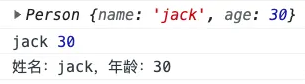
console.log()
Common log output, the most frequently used printing method for frontend developers.
function Person() {
this.name = "jack";
this.age = 30;
}
let person = new Person();
// View properties and methods of the person object
console.log(person);
// You can output name and age simultaneously
console.log(person.name, person.age);
// You can also use placeholders for output
console.log("Name: %s, Age: %d", person.name, person.age);
Output:

Template strings are definitely simpler than placeholders, but we won't discuss that here.
console.warn()
Used to output warning messages in the console. Same usage as console.log, but with a different style. Output via warn shows a yellow warning icon in front.
Output:

console.info()
Used to output informational messages in the console. Same usage and style as console.log.
Output:

console.error()
Used to output error messages in the console. Same usage as console.log, but with a different style. Output via error shows an error icon in front.
Output:

console.time()
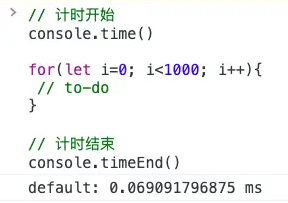
If you want to get the execution time of a piece of code, you can use console.time() to start timing and console.timeEnd() to end it.
// Start timing
console.time();
for (let i = 0; i < 1000; i++) {
// to-do
}
// End timing
console.timeEnd();
Output:

Note:
console.timeEnd()cannot be used alone; you must first defineconsole.time(). Otherwise, you'll get:VM578:1 Timer 'default' does not exist.
console.count()
If you want to get the execution count of code, you can use console.count().
for (let i = 0; i < 5; i++) {
// Count
console.count();
}
Output:

You can also pass a parameter as a label, e.g.,
console.count('Count: ').
These are some common methods for debugging via console printing. There are many others, but the less common and low-frequency ones won't be listed here.
debugger
Besides console logging, debugger is commonly used. When the program errors or you can't find the problem, you define debugger in the code to pause execution and analyze the issue.
let list = [{ name:'jack' , age: 30 , info:{ score: 70} },{ name:'tom' , age: 28 }]
for (let item of list) {
debugger;
if (item.info.score > 60) {
console.log(`Congratulations: ${item.name}`);
}
}
The above code will obviously error. If the program is more complex, we need breakpoint debugging. Through debugger, we can see that item.info is null, causing the error.
Debugging:

Chrome Breakpoints
Whether you write console.log or debugger in code, it's an intrusive breakpoint. After solving the problem, you need to manually remove them. But did you know that the browser itself can set breakpoints?
Take Vue3 as an example. Open the console, go to Sources, use ctrl + p to search for the user management menu file User.vue, and click where you want to set a breakpoint.

If you accidentally set many breakpoints, how to quickly clear them?

When you hit a breakpoint, hovering over a variable shows its value, hovering over an object shows its properties and methods. The right panel includes: Watch, Breakpoints, Scope, Call Stack, etc.

Chrome Conditional Breakpoints
If you are debugging code in a loop, you might have to step through each iteration until the condition is met to see the variable value. This is time-consuming and a clumsy method. Is there a better way?
- Find the code snippet to debug.

- Right-click and select Conditional Breakpoint.

- The breakpoint is triggered only when
userId == 1000002.

- The breakpoint is triggered only when the condition is met.

Conditional breakpoints: incredibly useful, highly recommended!

Frontend Master
Request Resend
When debugging with backend APIs, if the request is too fast and the backend can't check logs in time, they might ask the frontend: Send the request again, I need to debug. So we stupidly refresh the page, not knowing that the browser has a built-in request resend feature.
Steps:
- Open the console.
- Go to Network.
- Find the request to resend.
- Right-click and select Replay XHR.
You'll see the request sent again...
Before request replay:

After request replay:

Sending Requests from Console
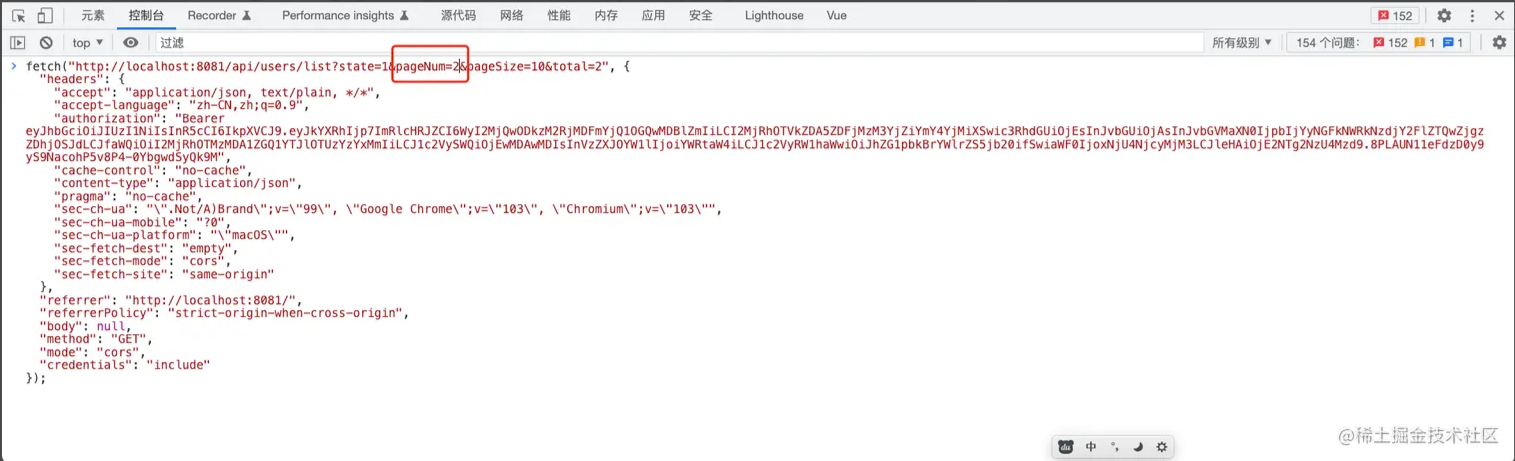
What if you need to modify parameters when resending a request?
- Open the console.
- Go to Network.
- Find the request whose parameters you want to modify.
- Right-click and select Copy -> Copy as fetch.
- Paste it in the console.
- Modify the request parameters and press Enter.
- Copy the request.

- Modify the pagination parameter to page 2:

- Press Enter to send the request.

HTML Node Copy
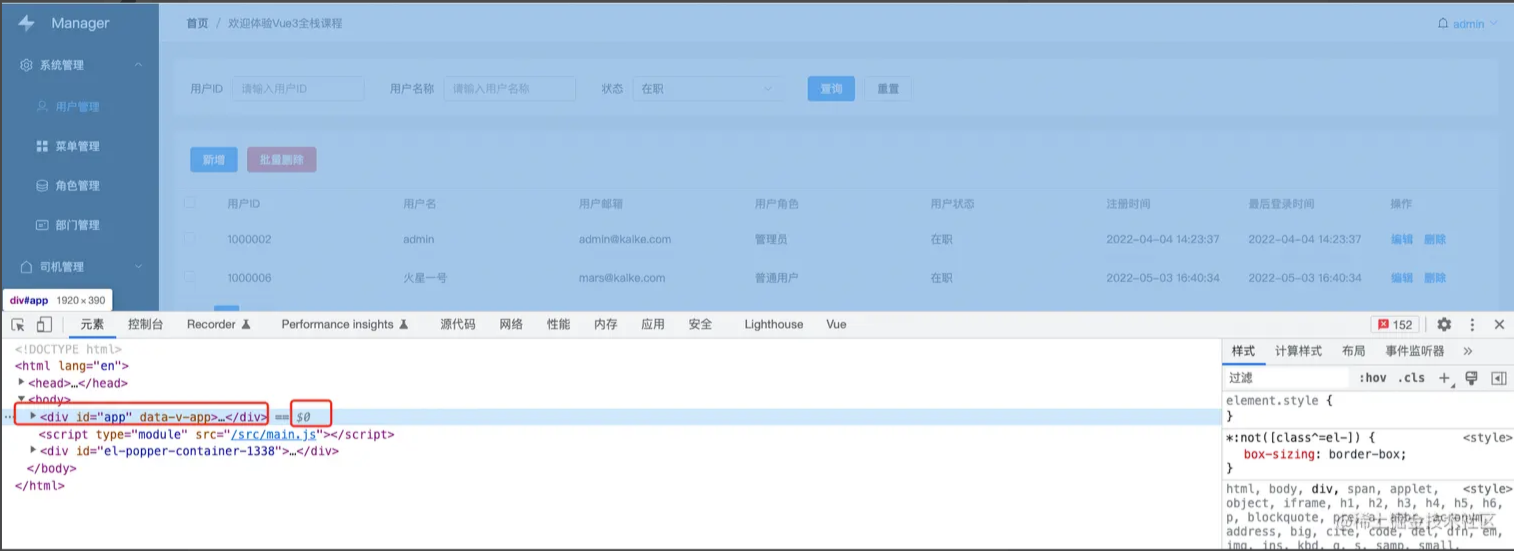
When a page layout goes wrong, we often inspect elements and use DOM APIs to debug read/write in the console. But DOM APIs can be cumbersome. Did you know the browser has built-in API features?
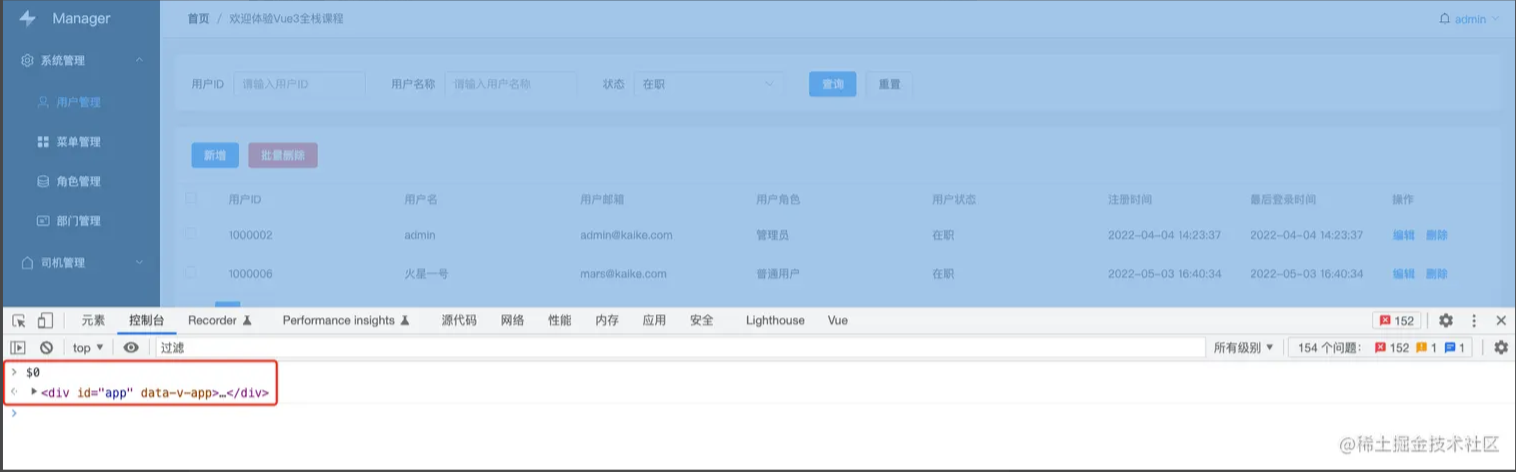
- When you select an HTML node, the
$0variable is automatically generated.

- Typing
$0in the console prints the selected node.

- Use
$or$$as a shortcut fordocument.querySelector().

This is incredibly useful! If you didn't know, you're really out of the loop. Chrome knows frontend developers well.
JavaScript Object Copy
Sometimes we print a complex object via console.log and need to expand it layer by layer to view, which is inconvenient. Is there a better way?
function Person() {
this.name = "jack";
this.age = 30;
}
let person = new Person();
// View properties and methods of the person object
console.log(person);
The browser has a built-in copy function.
- Type
copy(person).

- Paste directly.
The console will format and print the object, no need to expand layer by layer. Isn't that convenient?
More useful variables:
$// Simplydocument.querySelector.$$// Simplydocument.querySelectorAll.$_// The value of the previous expression.$0-$4// The last 5 DOM elements selected in the Elements panel (will be explained later).dir// Actuallyconsole.dir.keys// Get the key names of an object, returns an array of key names.values// Get the values of an object, returns an array of values.
Local File Override Remote
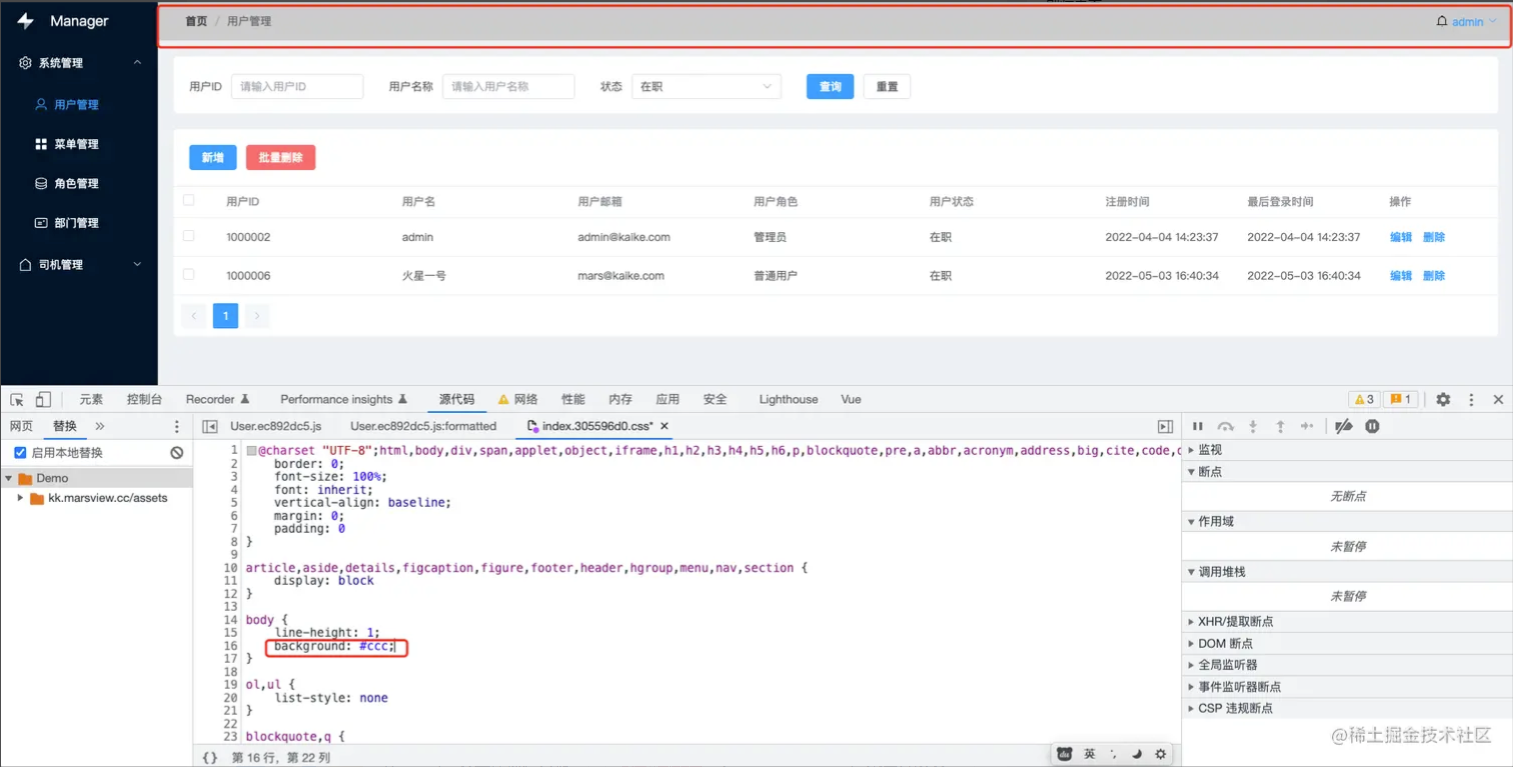
I once encountered a scenario where a project was deployed to a server, but there was no local repository code, and the server had all minified code. Debugging became very difficult. A common approach is to download the server's minified files, run them locally via nginx, debug, modify the files, and redeploy. But did you know the browser provides an overrides feature?
- Open the console.
- Go to Sources and click Overrides.

- Click the
+button and select a folder (you can create a folder on your desktop). - Click Allow.

- Refresh the page.
- Go to Network, find the file (
cssorjs) you want to modify, right-click, and select Save for overrides.

- The remote file is now downloaded to the local folder.

- Directly modify the code in the file, and the page will update synchronously.

- After modification, save the file.
- Deploy the local file back to the remote server.
These are the various debugging capabilities I've compiled for you. I hope you like them. I'm Riverside Corner.